Aperture Photometry JWST for Image Analyst
Aperture photometry is the measurement of light which falls inside a particular aperture; usually, we mean a circular aperture of some fixed size. This project is dedicated to performing aperture photometry on identified sources of protostellar outflows in the NGC 3324 region of the Carina Nebula.
The formula for calculating the radius of the apertures is defined as,

Where $\lambda$ is the central wavelength and D is the diameter of the telescope (6.5m). This is twice the diffraction limit of each individual filter in arcseconds.
# use the entire screen width for the notebook
from IPython.core.display import display, HTML
display(HTML("<style>.container { width:95% !important; }</style>"))
# make interactive plots
%matplotlib notebook
# Imports
import numpy as np
import matplotlib.pyplot as plt
import pandas as pd
import glob # for filepath handling
import sys
#
import warnings
warnings.filterwarnings('ignore')
#
# Astropy:
from astropy.stats import SigmaClip
import astropy.units as u
from astropy.coordinates import SkyCoord
from astropy.io import fits
from astropy.wcs import WCS
from astropy.visualization import simple_norm
from photutils.aperture import CircularAperture, CircularAnnulus, ApertureStats, aperture_photometry
import reproject as rpj # needed for reproject module

sys.path.append('../code')
from reproject_combine import reproject, make_rgb
from continuum_sub import ContinuumSubtract
import outflow_lookup as ol
path_to_file = '/mnt/c/Users/mukhamad-a/OneDrive - Playground/Data Science/outflow_sources_NGC3324.xlsx' # Set file path of the excel file
dict_ = ol.get_dictionary(path_to_file)
def sort_fnames(file_names):
    """ Function for sorting string lists of file names. Follows JWST naming conventions for naming .fits files."""
    # First get list of integers
    int_ind = []
    for f in file_names:
        num = f[-14:-10]

        if num[0] == 'f': # Accounts for MIRI f1130 band and up
            num = int(num[1:])
        else:
            pass

        int_ind.append(int(num))

    # Now sort the list of int returning indices that would sort the array
    sort_indices = np.argsort(int_ind)
    file_arr = np.array(file_names)
    sorted_fnames = file_arr[sort_indices] # re-arrange fnames

    return sorted_fnames # returns array of sorted fnames
# Get image directory and get files for imaging and plot generation
img_dir = '/mnt/d/st_images/Carina_level3/'
files = glob.glob(img_dir+'*')[3:] # Gets all JWST images including MIRI, excluding folders
files = sort_fnames(files) # sort them in ascending wavelength number
print('Files found:')
for f in files:
    print(f)
Files found:
/mnt/d/st_images/Carina_level3/jw02731-o001_t017_nircam_clear-f090w_i2d.fits
/mnt/d/st_images/Carina_level3/jw02731-o001_t017_nircam_clear-f187n_i2d.fits
/mnt/d/st_images/Carina_level3/jw02731-o001_t017_nircam_clear-f200w_i2d.fits
/mnt/d/st_images/Carina_level3/jw02731-o001_t017_nircam_clear-f335m_i2d.fits
/mnt/d/st_images/Carina_level3/jw02731-o001_t017_nircam_clear-f444w_i2d.fits
/mnt/d/st_images/Carina_level3/jw02731-o001_t017_nircam_f444w-f470n_i2d.fits
/mnt/d/st_images/Carina_level3/jw02731-o002_t017_miri_f770w_i2d.fits
/mnt/d/st_images/Carina_level3/jw02731-o002_t017_miri_f1130w_i2d.fits
/mnt/d/st_images/Carina_level3/jw02731-o002_t017_miri_f1280w_i2d.fits
/mnt/d/st_images/Carina_level3/jw02731-o002_t017_miri_f1800w_i2d.fits
# Set target header/data for reprojection
with fits.open(files[5]) as hdu:
    tar_header = hdu[1].header
    tar_data = hdu[1].data

target_wcs = WCS(tar_header)
# Reproject all image files onto target image (F444W-F470N)
reproj = reproject(files, target_wcs, tar_data)
We will now do a similar process to what was done to get the pixel values for aperture photometry. We will crop the reprojected images and then do the photometry on the products. Using sky coordinates would be optimal, but this batch of MIRI images from JWST had incorrect WCS header information and so the reprojected images are slightly offset from the NIRCam images. So we must result to using pixel values rather than coordinates for aperture setting. Also, we will work with individual sources rather than setting apertures on the full image.
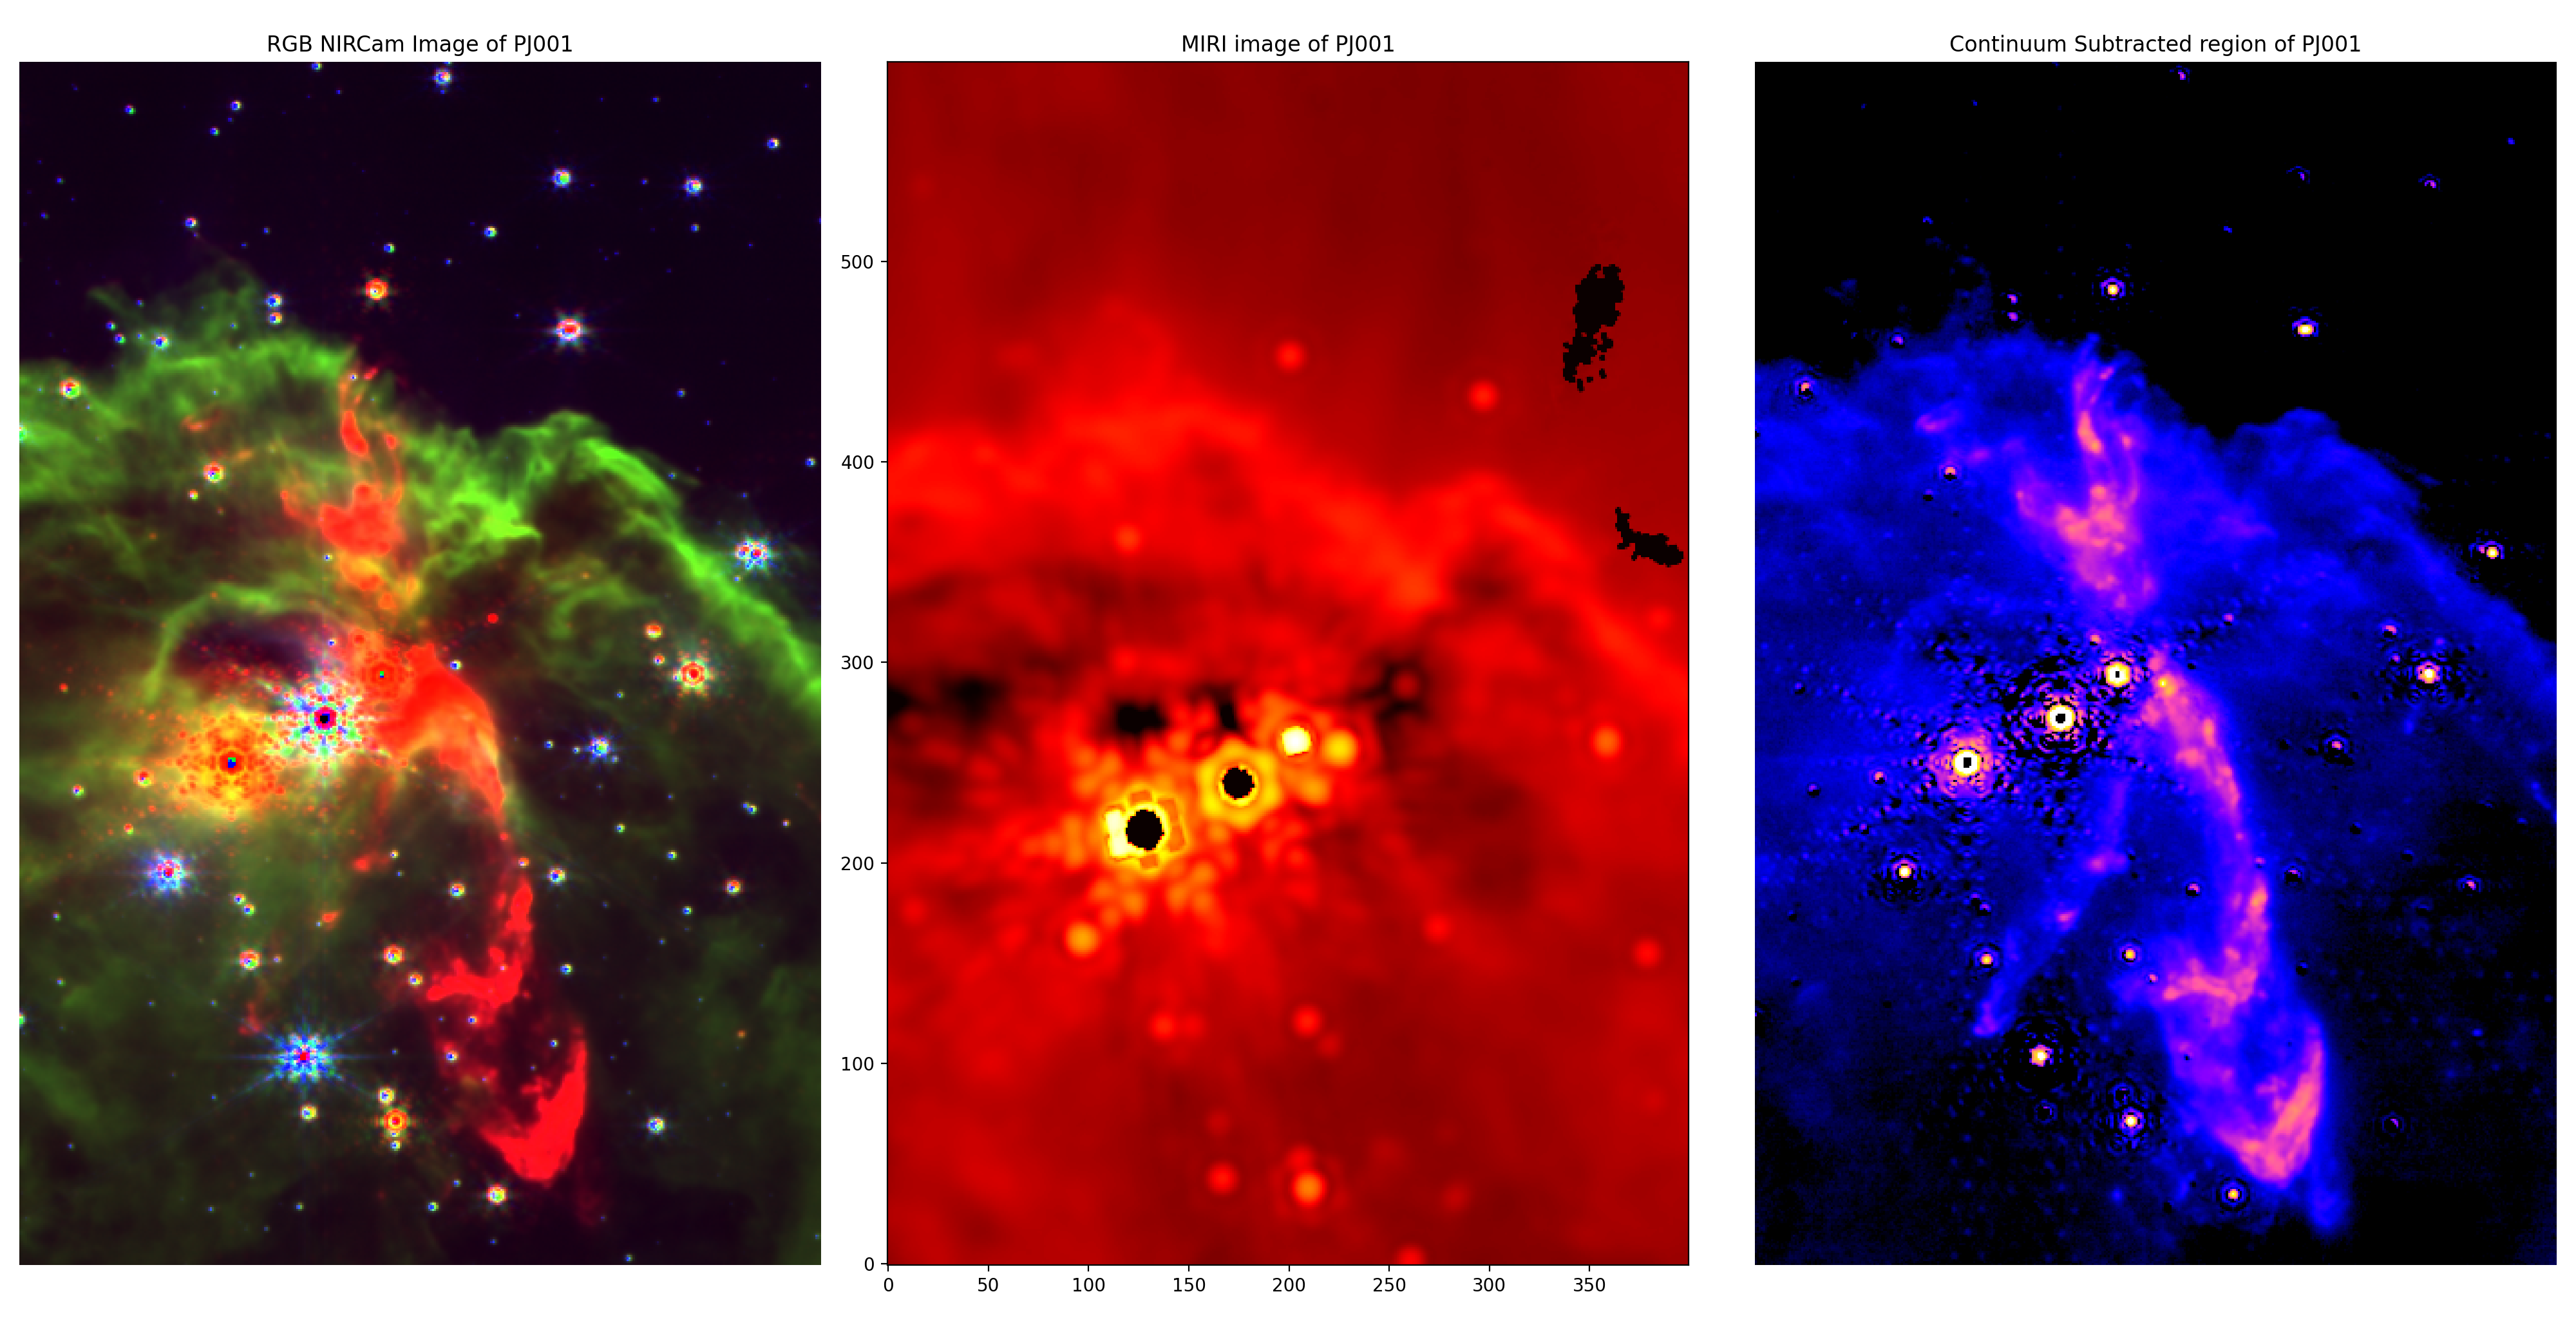
source-1 (PJ001)

focus = 'PJ001' # set desired focus
coords = ol.get_coordinates(path_to_file, focus) # Get coordinates of the source from the excel file
pixel_x, pixel_y = target_wcs.world_to_pixel(coords) # get pixel coordinates of the outflow
pixel_x, pixel_y = int(pixel_x), int(pixel_y)
region = ol.pixel_region(pixel_x, pixel_y, custom_bounds=(200,200,300,300))

# Crop images onto desired region
cropped = ol.crop_images(reproj, region)

factor = ((0.063 * u.arcsec) ** 2) / u.pixel # pixel scale (area per pixel)
data = u.Quantity(cropped[-1], unit= u.MJy / u.sr) # F1800W MIRI image as data
converted_data = (data * factor).to(u.Jy / u.pixel) # convert from units of MJy/sr to Jy/pix
We will place an aperture on the theorised host star on the MIRI image along with an annulus and plot it below to confirm we have a correct radius set.
Other possible source of PJ001
The exact source of PJ001 is not clear. So we will also perform astro-photometry on the nearby star, another possible source.
pos = [(225, 257), (212, 237)] # set central positions of apertures
factor = 1 / 0.063 # plate scale = 0.063"/pixel
radius = 1.9 * (1.22) * (18e-6 / 6.5) * (180 / np.pi) * 3600 * factor # radius defined as twice the diffraction limit
apertures = CircularAperture(pos, r=radius)
annulus = CircularAnnulus(pos, r_in=23, r_out=30)
fig, axs = plt.subplots(1,1)
fig.set_size_inches(20, 16)

axs.imshow(cropped[-1], origin='lower', norm = simple_norm(cropped[-1], stretch='log', log_a=100, invalid=0, min_cut=170), cmap='hot')
axs.set_title(f'MIRI image of {focus}')

ap_patch = apertures.plot(color='w', lw=2, label='Photometry aperture')
ann_patch = annulus.plot(color='k', lw=2, label='Background annulus')
plt.legend(loc='best')
plt.tight_layout()
<IPython.core.display.Javascript object>
# Get stats on background, so we can subtract it. (Local Background Subtraction)
sigclip = SigmaClip(sigma=1, maxiters=10) # sigma clip due to bright star in annulus
bkg_stats = ApertureStats(converted_data.value, annulus, sigma_clip=sigclip)
aper_stats = ApertureStats(converted_data.value, apertures)
aper_stats_bkgsub = ApertureStats(converted_data.value, apertures, local_bkg=bkg_stats.median) # Take the background median away from data
bkg_median = bkg_stats.median
print('Median of apertures:')
print(bkg_median)
Median of apertures:
[1.77942881e-05 2.20291722e-05]
We now have aperture statistics both with and without background. Now a table of properties is made for the apertures above.
# Print a table with full list of properties
t = aper_stats_bkgsub.to_table()
for col in t.colnames:
    if col == 'sky_centroid':
        pass
    else:
        t[col].info.format = '%.8g'
t['id'][:] = [1, 1]
t.show_in_notebook()
QTable length=2
| idx | id | xcentroid | ycentroid | sky_centroid | sum | sum_err | sum_aper_area | center_aper_area | min | max | mean | median | mode | std | mad_std | var | biweight_location | biweight_midvariance | fwhm | semimajor_sigma | semiminor_sigma | orientation | eccentricity |
|---|---|---|---|---|---|---|---|---|---|---|---|---|---|---|---|---|---|---|---|---|---|---|---|
| pix2 | pix2 | pix | pix | pix | deg | ||||||||||||||||||
| 0 | 1 | 214.8561 | 258.02183 | None | 0.061886952 | nan | 1387.5997 | 1373 | 5.8347791e-07 | 0.00095328077 | 4.3991127e-05 | 1.61833e-05 | -3.9432353e-05 | 0.00011280926 | 1.567327e-05 | 1.272593e-08 | 1.5640835e-05 | 2.5287746e-10 | 19.384616 | 9.8191311 | 6.2540099 | -14.879723 | 0.77092915 |
| 1 | 1 | 207.9717 | 244.04664 | None | 0.033468442 | nan | 1387.5997 | 1373 | -1.9842662e-06 | 0.00067685773 | 2.3656491e-05 | 1.5493832e-05 | -8.3148628e-07 | 4.3875713e-05 | 1.8064624e-05 | 1.9250782e-09 | 1.6341404e-05 | 3.2103485e-10 | 21.904496 | 10.152878 | 8.3649767 | 35.876519 | 0.56673232 |
mask = apertures.to_mask()
values_1 = []
for i, _ in enumerate(apertures):
    val = mask[i].get_values(converted_data.value) # get all values for the aperture if needed.
    values_1.append(val)
# Write array values to .txt file
fname = 'miri_aper_values_source1.txt'
arr = np.array(values_1[0])
out_file = open(fname, 'w')
for i in range(len(arr)):
    print(arr[i], file=out_file)
source-6 (PJ006)

focus = 'PJ006' # set desired focus
coords = ol.get_coordinates(path_to_file, focus) # Get coordinates of the source from the excel file
pixel_x, pixel_y = target_wcs.world_to_pixel(coords) # get pixel coordinates of the outflow
pixel_x, pixel_y = int(pixel_x), int(pixel_y)
region = ol.pixel_region(pixel_x, pixel_y, custom_bounds=(100,160,100,120))

# Crop images onto desired region
cropped = ol.crop_images(reproj, region)

factor = ((0.063 * u.arcsec) ** 2) / u.pixel # pixel scale (area per pixel)
data = u.Quantity(cropped[7], unit= u.MJy / u.sr) # F1130W MIRI image as data
converted_data = (data * factor).to(u.Jy / u.pixel) # convert from units of MJy/sr to Jy/pix
pos = (100, 97.5) # set central positions of apertures
factor = 1 / 0.063 # plate scale = 0.063"/pixel
radius = 2 * (1.22) * (11.3e-6 / 6.5) * (180 / np.pi) * 3600 * factor # radius defined as twice the diffraction limit
aperture = CircularAperture(pos, r=radius)
annulus = CircularAnnulus(pos, r_in=20, r_out=25)
fig, axs = plt.subplots(1,1)
fig.set_size_inches(20, 16)

axs.imshow(cropped[7], origin='lower', norm = simple_norm(cropped[7], stretch='log', log_a=50, invalid=0, min_cut=0), cmap='hot')
axs.set_title(f'MIRI image of {focus}')

ap_patch = aperture.plot(color='w', lw=2, label='Photometry aperture')
ann_patch = annulus.plot(color='k', lw=2, label='Background annulus')
plt.legend(loc='best')
plt.tight_layout()
<IPython.core.display.Javascript object>
# Get stats on background, so we can subtract it. (Local Background Subtraction)
bkg_stats = ApertureStats(converted_data.value, annulus)
aper_stats = ApertureStats(converted_data.value, aperture)
aper_stats_bkgsub = ApertureStats(converted_data.value, aperture, local_bkg=bkg_stats.median) # Take the background median away from data
bkg_median = bkg_stats.median
print('Median of apertures:')
print(bkg_median)
Median of apertures:
6.088006454125928e-06
# Print a table with full list of properties
t = aper_stats_bkgsub.to_table()
for col in t.colnames:
    if col == 'sky_centroid':
        pass
    else:
        t[col].info.format = '%.8g'
t['id'][:] = [6]
t.show_in_notebook()
QTable length=1
| idx | id | xcentroid | ycentroid | sky_centroid | sum | sum_err | sum_aper_area | center_aper_area | min | max | mean | median | mode | std | mad_std | var | biweight_location | biweight_midvariance | fwhm | semimajor_sigma | semiminor_sigma | orientation | eccentricity |
|---|---|---|---|---|---|---|---|---|---|---|---|---|---|---|---|---|---|---|---|---|---|---|---|
| pix2 | pix2 | pix | pix | pix | deg | ||||||||||||||||||
| 0 | 6 | 100.36817 | 97.623202 | None | 0.0091899611 | nan | 605.93895 | 608 | -1.0394475e-06 | 0.00015828685 | 1.5122451e-05 | 4.4280449e-06 | -1.6960767e-05 | 2.9661511e-05 | 2.8760425e-06 | 8.7980521e-10 | 3.9122153e-06 | 7.3454668e-12 | 8.9954583 | 3.9407236 | 3.6953747 | 16.151108 | 0.34733763 |
mask = aperture.to_mask()
values_6 = mask.get_values(converted_data.value) # get all values for the aperture if needed.
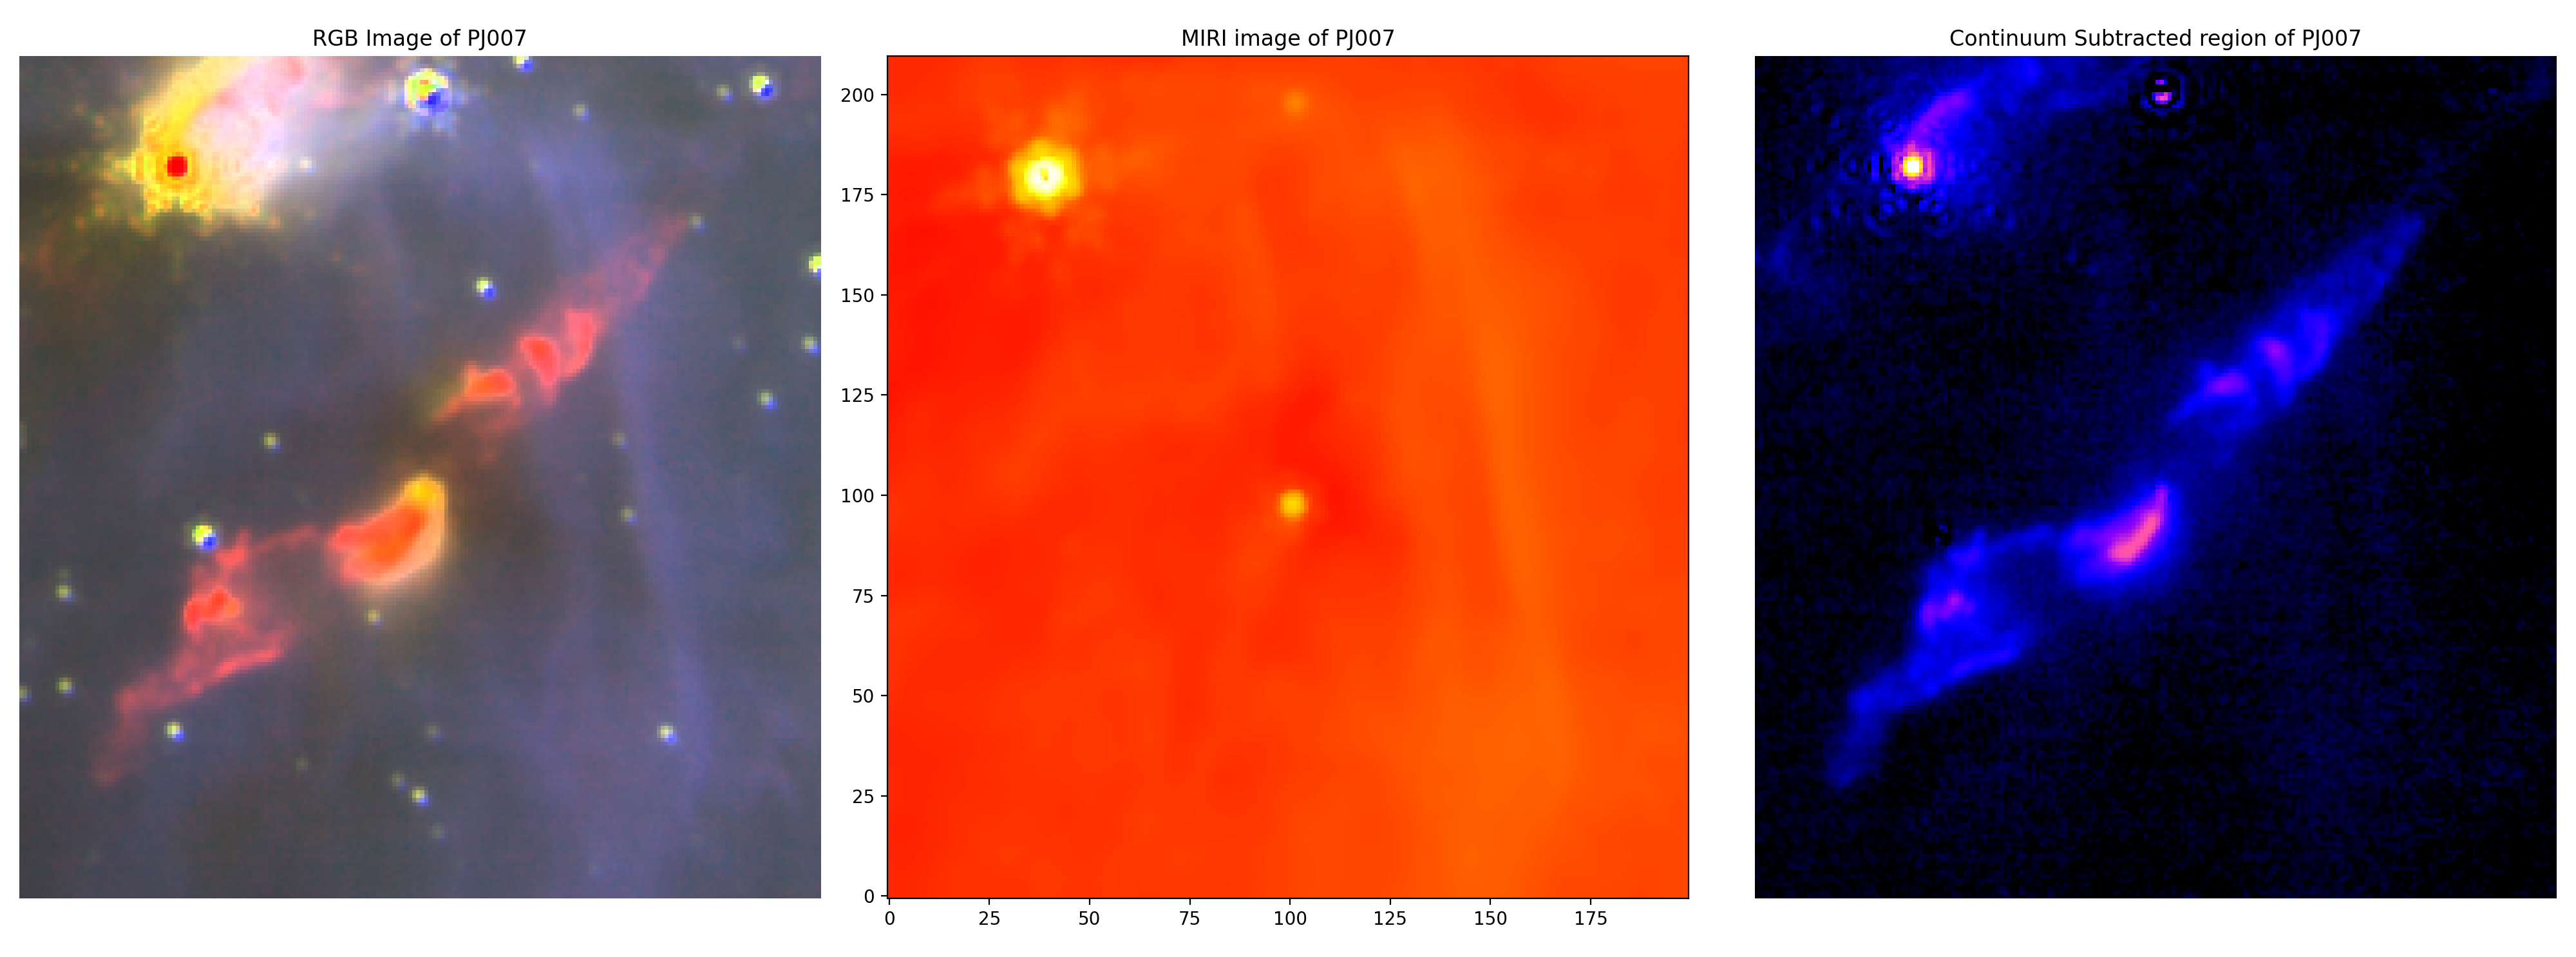
source-7 (PJ007)

focus = 'PJ007' # set desired focus
coords = ol.get_coordinates(path_to_file, focus) # Get coordinates of the source from the excel file
pixel_x, pixel_y = target_wcs.world_to_pixel(coords) # get pixel coordinates of the outflow
pixel_x, pixel_y = int(pixel_x), int(pixel_y)
region = ol.pixel_region(pixel_x, pixel_y, custom_bounds=(100,100,100,110))

# Crop images onto desired region
cropped = ol.crop_images(reproj, region)

factor = ((0.063 * u.arcsec) ** 2) / u.pixel # pixel scale (area per pixel)
data = u.Quantity(cropped[6], unit= u.MJy / u.sr) # F770W MIRI image as data
converted_data = (data * factor).to(u.Jy / u.pixel) # convert from units of MJy/sr to Jy/pix
pos = (101, 97.5) # set central positions of apertures

factor = 1 / 0.063 # plate scale = 0.063"/pixel
radius = 2 * (1.22) * (7.7e-6 / 6.5) * (180 / np.pi) * 3600 * factor # radius defined as twice the diffraction limit

aperture = CircularAperture(pos, r=radius)
annulus = CircularAnnulus(pos, r_in=20, r_out=25)
fig, axs = plt.subplots(1,1)
fig.set_size_inches(20, 16)

axs.imshow(cropped[6], origin='lower', norm = simple_norm(cropped[6], stretch='log', invalid=0, min_cut=0), cmap='hot')
axs.set_title(f'MIRI image of {focus}')

ap_patch = aperture.plot(color='w', lw=2, label='Photometry aperture')
ann_patch = annulus.plot(color='k', lw=2, label='Background annulus')
plt.legend(loc='best')
plt.tight_layout()
<IPython.core.display.Javascript object>
# Get stats on background, so we can subtract it. (Local Background Subtraction)
bkg_stats = ApertureStats(converted_data.value, annulus)
aper_stats = ApertureStats(converted_data.value, aperture)
aper_stats_bkgsub = ApertureStats(converted_data.value, aperture, local_bkg=bkg_stats.median) # Take the background median away from data
bkg_median = bkg_stats.median
print('Median of apertures:')
print(bkg_median)
Median of apertures:
4.106795917915792e-06
# Print a table with full list of properties
t = aper_stats_bkgsub.to_table()
for col in t.colnames:
    if col == 'sky_centroid':
        pass
    else:
        t[col].info.format = '%.8g'
t['id'][:] = [7]
t.show_in_notebook()
QTable length=1
| idx | id | xcentroid | ycentroid | sky_centroid | sum | sum_err | sum_aper_area | center_aper_area | min | max | mean | median | mode | std | mad_std | var | biweight_location | biweight_midvariance | fwhm | semimajor_sigma | semiminor_sigma | orientation | eccentricity |
|---|---|---|---|---|---|---|---|---|---|---|---|---|---|---|---|---|---|---|---|---|---|---|---|
| pix2 | pix2 | pix | pix | pix | deg | ||||||||||||||||||
| 0 | 7 | 99.802145 | 96.912526 | None | 0.00056846865 | nan | 281.35422 | 278 | -9.3192261e-07 | 2.1047617e-05 | 2.0462707e-06 | 5.7888722e-07 | -2.3558797e-06 | 4.1924192e-06 | 1.128552e-06 | 1.7576379e-11 | 4.4809382e-07 | 1.2308537e-12 | 4.6519995 | 2.2491202 | 1.6573578 | 78.256529 | 0.67601091 |
mask = aperture.to_mask()
values_7 = mask.get_values(converted_data.value) # get all values for the aperture if needed.
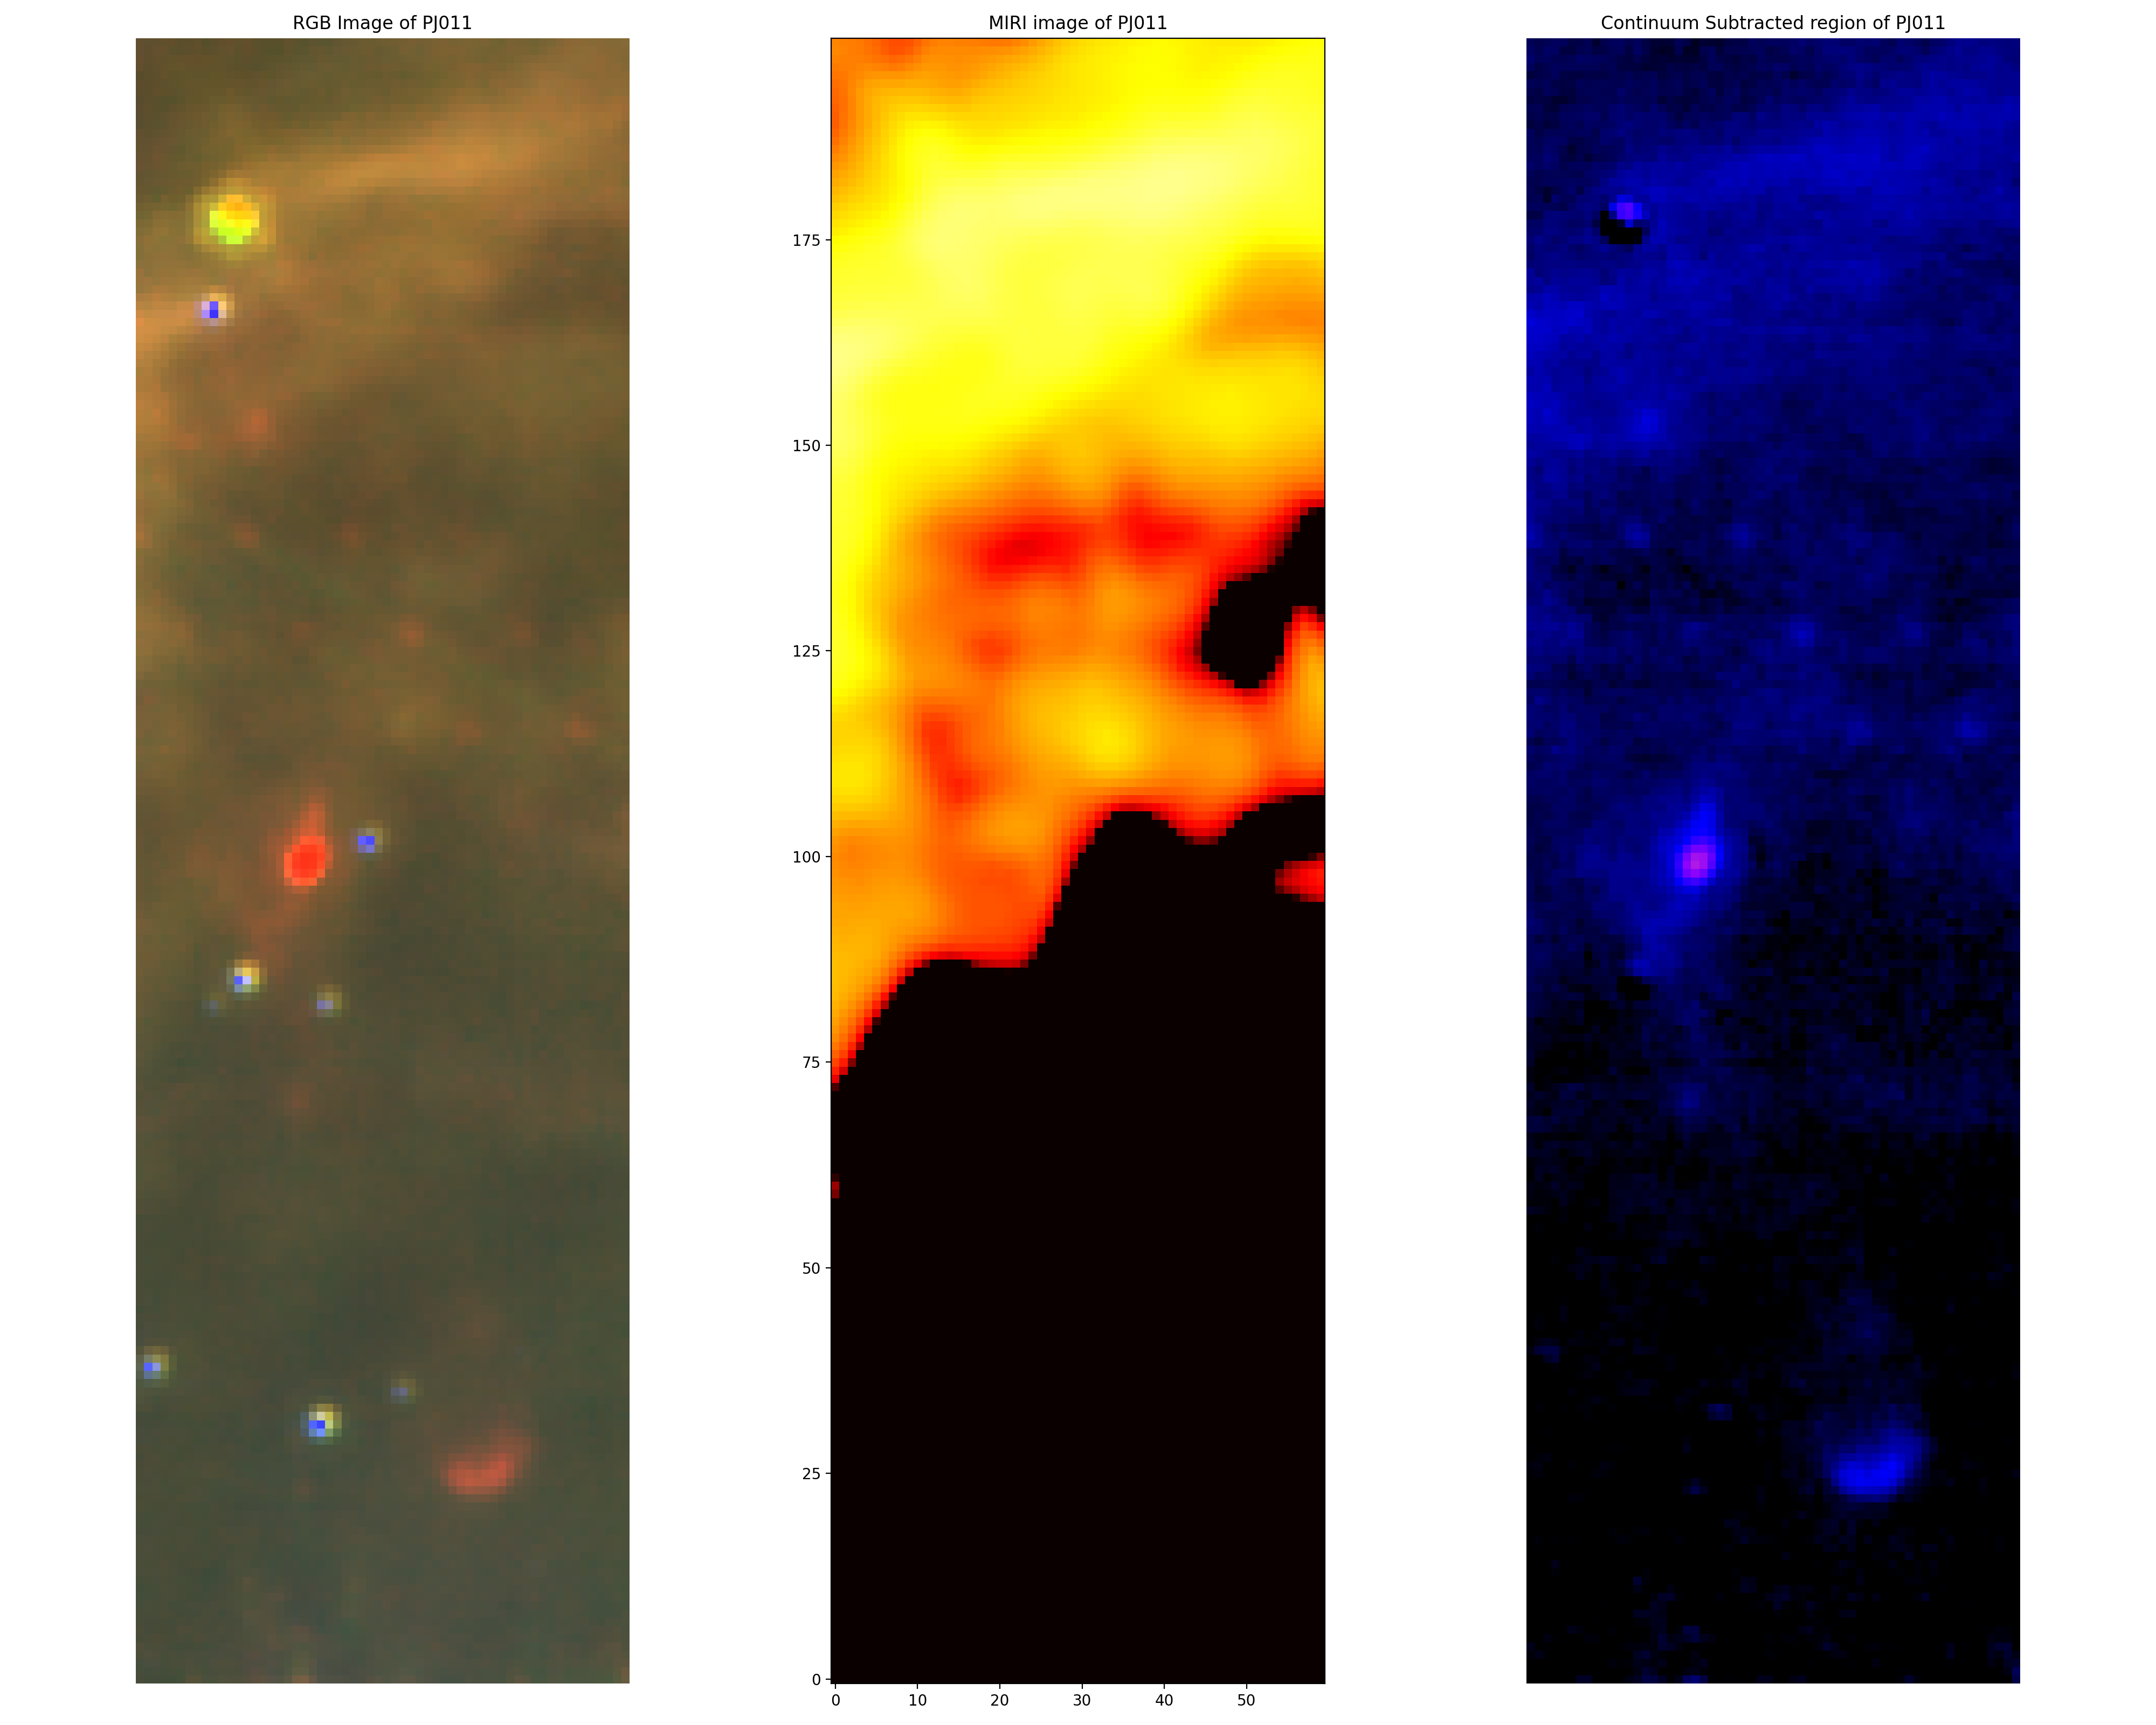
source-11

focus = 'PJ011' # set desired focus
coords = ol.get_coordinates(path_to_file, focus) # Get coordinates of the source from the excel file
pixel_x, pixel_y = target_wcs.world_to_pixel(coords) # get pixel coordinates of the outflow
pixel_x, pixel_y = int(pixel_x), int(pixel_y)
region = ol.pixel_region(pixel_x, pixel_y, custom_bounds=(20,40,100,100))

# Crop images onto desired region
cropped = ol.crop_images(reproj, region)

factor = ((0.063 * u.arcsec) ** 2) / u.pixel # pixel scale (area per pixel)
data = u.Quantity(cropped[5], unit= u.MJy / u.sr) # F444w-F470N NIRCam image as data
converted_data = (data * factor).to(u.Jy / u.pixel) # convert from units of MJy/sr to Jy/pix
pos = (20, 101) # set central positions of apertures
factor = 1 / 0.063 # plate scale = 0.063"/pixel
radius = 2 * (1.22) * (4.7e-6 / 6.5) * (180 / np.pi) * 3600 * factor # radius defined as twice the diffraction limit
aperture = CircularAperture(pos, r=7)
annulus = CircularAnnulus(pos, r_in=20, r_out=25)
fig, axs = plt.subplots(1,1)
fig.set_size_inches(20, 16)

axs.imshow(cropped[5], origin='lower', norm = simple_norm(cropped[5], stretch='log', log_a=100, invalid=0, min_cut=0), cmap='hot')
axs.set_title(f'NIRCam image of {focus}')

ap_patch = aperture.plot(color='w', lw=2, label='Photometry aperture')
ann_patch = annulus.plot(color='k', lw=2, label='Background annulus')
plt.legend(loc='best')
plt.tight_layout()
<IPython.core.display.Javascript object>
# Get stats on background, so we can subtract it. (Local Background Subtraction)
bkg_stats = ApertureStats(converted_data.value, annulus)
aper_stats = ApertureStats(converted_data.value, aperture)
aper_stats_bkgsub = ApertureStats(converted_data.value, aperture, local_bkg=bkg_stats.median) # Take the background median away from data
bkg_median = bkg_stats.median
print('Median of apertures:')
print(bkg_median)
Median of apertures:
3.5729745461913834e-07
# Print a table with full list of properties
t = aper_stats_bkgsub.to_table()
for col in t.colnames:
    if col == 'sky_centroid':
        pass
    else:
        t[col].info.format = '%.8g'
t['id'][:] = [11]
t.show_in_notebook()
QTable length=1
| idx | id | xcentroid | ycentroid | sky_centroid | sum | sum_err | sum_aper_area | center_aper_area | min | max | mean | median | mode | std | mad_std | var | biweight_location | biweight_midvariance | fwhm | semimajor_sigma | semiminor_sigma | orientation | eccentricity |
|---|---|---|---|---|---|---|---|---|---|---|---|---|---|---|---|---|---|---|---|---|---|---|---|
| pix2 | pix2 | pix | pix | pix | deg | ||||||||||||||||||
| 0 | 11 | 20.107608 | 100.23149 | None | 4.7459365e-05 | nan | 153.93804 | 145 | 5.1410348e-08 | 2.2184838e-06 | 3.222854e-07 | 1.58484e-07 | -1.691188e-07 | 4.1859386e-07 | 1.1339579e-07 | 1.7522082e-13 | 1.5561315e-07 | 1.4231125e-14 | 5.6675505 | 2.6316113 | 2.1586732 | 77.863046 | 0.57195397 |
mask = aperture.to_mask()
values_11 = mask.get_values(converted_data.value) # get all values for the aperture if needed.
source-12 (PJ012)

We will use a NIRCam image to perform photometry on the star as the theorised source is unresolved in the MIRI image.
focus = 'PJ012' # set desired focus
coords = ol.get_coordinates(path_to_file, focus) # Get coordinates of the source from the excel file
pixel_x, pixel_y = target_wcs.world_to_pixel(coords) # get pixel coordinates of the outflow
pixel_x, pixel_y = int(pixel_x), int(pixel_y)
region = ol.pixel_region(pixel_x, pixel_y, custom_bounds=(200,130,70,200))

# Crop images onto desired region
cropped = ol.crop_images(reproj, region)

factor = ((0.063 * u.arcsec) ** 2) / u.pixel # pixel scale (area per pixel)
data = u.Quantity(cropped[4], unit= u.MJy / u.sr) # F444w NIRCam image as data
converted_data = (data * factor).to(u.Jy / u.pixel) # convert from units of MJy/sr to Jy/pix
pos = (200.7, 69.5) # set central positions of apertures
factor = 1 / 0.063 # plate scale = 0.063"/pixel
radius = 2 * (1.22) * (4.44e-6 / 6.5) * (180 / np.pi) * 3600 * factor # radius defined as twice the diffraction limit
aperture = CircularAperture(pos, r=radius)
annulus = CircularAnnulus(pos, r_in=10, r_out=15)
fig, axs = plt.subplots(1,1)
fig.set_size_inches(20, 16)

axs.imshow(cropped[4], origin='lower', norm = simple_norm(cropped[4], stretch='log', log_a=100, invalid=0, min_cut=0), cmap='hot')
axs.set_title(f'NIRCam image of {focus}')

ap_patch = aperture.plot(color='w', lw=2, label='Photometry aperture')
ann_patch = annulus.plot(color='k', lw=2, label='Background annulus')
plt.legend(loc='best')
plt.tight_layout()
<IPython.core.display.Javascript object>
# Get stats on background, so we can subtract it. (Local Background Subtraction)
bkg_stats = ApertureStats(converted_data.value, annulus)
aper_stats = ApertureStats(converted_data.value, aperture)
aper_stats_bkgsub = ApertureStats(converted_data.value, aperture, local_bkg=bkg_stats.median) # Take the background median away from data
bkg_median = bkg_stats.median
print('Median of apertures:')
print(bkg_median)
Median of apertures:
4.1188862690205246e-07
# Print a table with full list of properties
t = aper_stats_bkgsub.to_table()
for col in t.colnames:
    if col == 'sky_centroid':
        pass
    else:
        t[col].info.format = '%.8g'
t['id'][:] = [12]
t.show_in_notebook()
QTable length=1
| idx | id | xcentroid | ycentroid | sky_centroid | sum | sum_err | sum_aper_area | center_aper_area | min | max | mean | median | mode | std | mad_std | var | biweight_location | biweight_midvariance | fwhm | semimajor_sigma | semiminor_sigma | orientation | eccentricity |
|---|---|---|---|---|---|---|---|---|---|---|---|---|---|---|---|---|---|---|---|---|---|---|---|
| pix2 | pix2 | pix | pix | pix | deg | ||||||||||||||||||
| 0 | 12 | 200.15741 | 68.435335 | None | 9.528288e-05 | nan | 93.548735 | 90 | -2.6521996e-09 | 4.7061433e-06 | 1.0252579e-06 | 5.3024994e-07 | -4.5976592e-07 | 1.1482339e-06 | 6.0760922e-07 | 1.3184411e-12 | 5.410148e-07 | 6.2015472e-13 | 4.7576881 | 2.3138923 | 1.6762958 | 57.038075 | 0.68932893 |
mask = aperture.to_mask()
values_12 = mask.get_values(converted_data.value) # get all values for the aperture if needed.
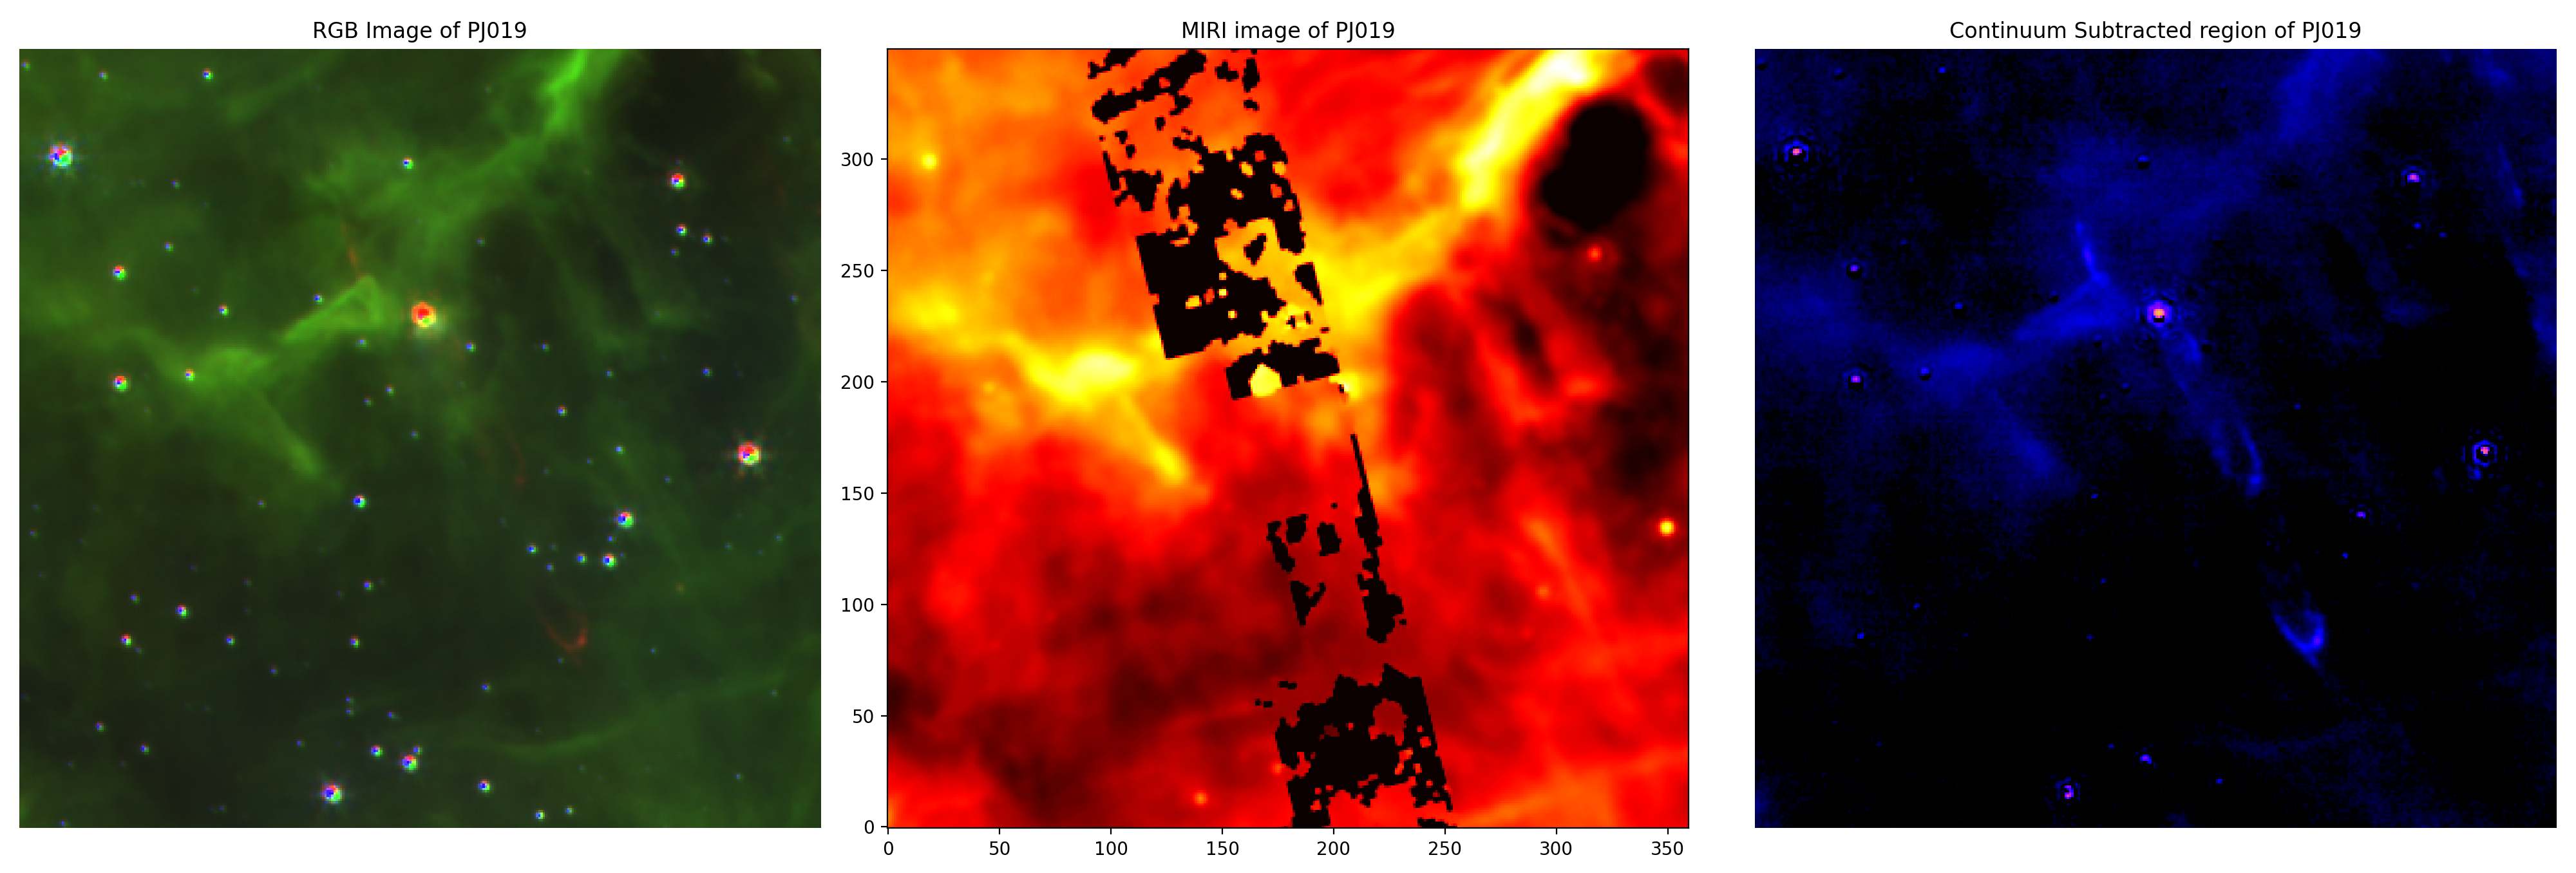
source-19 (PJ019)

We will once again use a NIRCam image to perform photometry on the star for similar reasons listed above.
focus = 'PJ019' # set desired focus
coords = ol.get_coordinates(path_to_file, focus) # Get coordinates of the source from the excel file
pixel_x, pixel_y = target_wcs.world_to_pixel(coords) # get pixel coordinates of the outflow
pixel_x, pixel_y = int(pixel_x), int(pixel_y)
region = ol.pixel_region(pixel_x, pixel_y, custom_bounds=(180, 180, 230, 120))

# Crop images onto desired region
cropped = ol.crop_images(reproj, region)

factor = ((0.063 * u.arcsec) ** 2) / u.pixel # pixel scale (area per pixel)
data = u.Quantity(cropped[5], unit= u.MJy / u.sr) # F444w-F470N NIRCam image as data
converted_data = (data * factor).to(u.Jy / u.pixel) # convert from units of MJy/sr to Jy/pix
pos = (181, 230) # set central positions of apertures
factor = 1 / 0.063 # plate scale = 0.063"/pixel
radius = 2 * (1.22) * (4.7e-6 / 6.5) * (180 / np.pi) * 3600 * factor # radius defined as twice the diffraction limit
aperture = CircularAperture(pos, r=radius)
annulus = CircularAnnulus(pos, r_in=15, r_out=20)
fig, axs = plt.subplots(1,1)
fig.set_size_inches(20, 16)

axs.imshow(cropped[5], origin='lower', norm = simple_norm(cropped[5], stretch='log', log_a=100, invalid=0, min_cut=0), cmap='hot')
axs.set_title(f'NIRCam image of {focus}')

ap_patch = aperture.plot(color='w', lw=2, label='Photometry aperture')
ann_patch = annulus.plot(color='k', lw=2, label='Background annulus')
plt.legend(loc='best')
plt.tight_layout()
<IPython.core.display.Javascript object>
# Get stats on background, so we can subtract it. (Local Background Subtraction)
bkg_stats = ApertureStats(converted_data.value, annulus)
aper_stats = ApertureStats(converted_data.value, aperture)
aper_stats_bkgsub = ApertureStats(converted_data.value, aperture, local_bkg=bkg_stats.median) # Take the background median away from data
bkg_median = bkg_stats.median
print('Median of apertures:')
print(bkg_median)
Median of apertures:
5.91098810624582e-07
# Print a table with full list of properties
t = aper_stats_bkgsub.to_table()
for col in t.colnames:
    if col == 'sky_centroid':
        pass
    else:
        t[col].info.format = '%.8g'
t['id'][:] = [19]
t.show_in_notebook()
QTable length=1
| idx | id | xcentroid | ycentroid | sky_centroid | sum | sum_err | sum_aper_area | center_aper_area | min | max | mean | median | mode | std | mad_std | var | biweight_location | biweight_midvariance | fwhm | semimajor_sigma | semiminor_sigma | orientation | eccentricity |
|---|---|---|---|---|---|---|---|---|---|---|---|---|---|---|---|---|---|---|---|---|---|---|---|
| pix2 | pix2 | pix | pix | pix | deg | ||||||||||||||||||
| 0 | 19 | 180.98546 | 229.95316 | None | 0.0007261677 | nan | 104.82568 | 101 | 6.5229762e-07 | 5.7776108e-05 | 7.1617053e-06 | 2.8176777e-06 | -5.8703776e-06 | 1.1049918e-05 | 1.6160435e-06 | 1.2210068e-10 | 2.5580423e-06 | 1.7973869e-12 | 4.1980341 | 1.8272187 | 1.7371248 | -28.475683 | 0.3101322 |
mask = aperture.to_mask()
values_19 = mask.get_values(converted_data.value) # get all values for the aperture if needed.
source-21 (PJ021)
focus = 'PJ021' # set desired focus
coords = ol.get_coordinates(path_to_file, focus) # Get coordinates of the source from the excel file
pixel_x, pixel_y = target_wcs.world_to_pixel(coords) # get pixel coordinates of the outflow
pixel_x, pixel_y = int(pixel_x), int(pixel_y)
region = ol.pixel_region(pixel_x, pixel_y, custom_bounds=(50, 50, 80, 50))

# Crop images onto desired region
cropped = ol.crop_images(reproj, region)

factor = ((0.063 * u.arcsec) ** 2) / u.pixel # pixel scale (area per pixel)
data = u.Quantity(cropped[5], unit= u.MJy / u.sr) # F444w-F470N NIRCam image as data
converted_data = (data * factor).to(u.Jy / u.pixel) # convert from units of MJy/sr to Jy/pix
pos = (50, 80) # set central positions of apertures
factor = 1 / 0.063 # plate scale = 0.063"/pixel
radius = 2 * (1.22) * (4.7e-6 / 6.5) * (180 / np.pi) * 3600 * factor # radius defined as twice the diffraction limit
aperture = CircularAperture(pos, r=radius)
annulus = CircularAnnulus(pos, r_in=15, r_out=20)
fig, axs = plt.subplots(1,1)
fig.set_size_inches(20, 16)

axs.imshow(cropped[5], origin='lower', norm = simple_norm(cropped[5], stretch='log', log_a=100, invalid=0, min_cut=0), cmap='hot')
axs.set_title(f'NIRCam image of {focus}')

ap_patch = aperture.plot(color='w', lw=2, label='Photometry aperture')
ann_patch = annulus.plot(color='k', lw=2, label='Background annulus')
plt.legend(loc='best')
plt.tight_layout()
<IPython.core.display.Javascript object>
# Get stats on background, so we can subtract it. (Local Background Subtraction)
bkg_stats = ApertureStats(converted_data.value, annulus)
aper_stats = ApertureStats(converted_data.value, aperture)
aper_stats_bkgsub = ApertureStats(converted_data.value, aperture, local_bkg=bkg_stats.median) # Take the background median away from data
bkg_median = bkg_stats.median
print('Median of apertures:')
print(bkg_median)
Median of apertures:
5.63654412687679e-07
# Print a table with full list of properties
t = aper_stats_bkgsub.to_table()
for col in t.colnames:
    if col == 'sky_centroid':
        pass
    else:
        t[col].info.format = '%.8g'
t['id'][:] = [21]
t.show_in_notebook()
QTable length=1
| idx | id | xcentroid | ycentroid | sky_centroid | sum | sum_err | sum_aper_area | center_aper_area | min | max | mean | median | mode | std | mad_std | var | biweight_location | biweight_midvariance | fwhm | semimajor_sigma | semiminor_sigma | orientation | eccentricity |
|---|---|---|---|---|---|---|---|---|---|---|---|---|---|---|---|---|---|---|---|---|---|---|---|
| pix2 | pix2 | pix | pix | pix | deg | ||||||||||||||||||
| 0 | 21 | 50.105014 | 80.078556 | None | 0.0010612818 | nan | 104.82568 | 101 | 9.6577569e-07 | 8.1531731e-05 | 1.0482058e-05 | 3.517837e-06 | -1.0410605e-05 | 1.6501911e-05 | 2.4533412e-06 | 2.7231306e-10 | 3.1331458e-06 | 4.7657673e-12 | 4.0306125 | 1.7955193 | 1.62344 | 17.05878 | 0.42719015 |
mask = aperture.to_mask()
values_21 = mask.get_values(converted_data.value) # get all values for the aperture if needed.