Brief History
A long standing goal in astrophysics is to directly observe the immediate environment of a black hole with angular resolution comparable to the event horizon. Such observations could lead to images of strong gravity effects that are expected near a black hole, and to the direct detection of dynamics near the black hole as matter orbits at near light speeds. This capability would open a new window on the study of general relativity in the strong field regime, accretion and outflow processes at the edge of a black hole, the existence of event horizons, and fundamental black hole physics.
The EHT is an international collaboration that has formed to continue the steady long-term progress on improving the capability of Very Long Baseline Interferometry (VLBI) at short wavelengths in pursuit of this goal. This technique of linking radio dishes across the globe to create an Earth-sized interferometer, has been used to measure the size of the emission regions of the two supermassive black holes with the largest apparent event horizons: SgrA* at the center of the Milky Way and M87 in the center of the Virgo A galaxy. In both cases, the sizes match that of the predicted silhouette caused by the extreme lensing of light by the black hole. Addition of key millimeter and submillimeter wavelength facilities at high altitude sites has now opened the possibility of imaging such features and sensing the dynamic evolution of black hole accretion. The EHT project includes theoretical and simulation studies that are framing questions rooted at the black hole boundary that may soon be answered through observations.
By linking together existing telescopes using novel systems, the EHT leverages considerable global investment to create a fundamentally new instrument with angular resolving power that is the highest possible from the surface of the Earth. Over the coming years, the international EHT team will mount observing campaigns of increasing resolving power and sensitivity, aiming to bring black holes into focus.

Package and Libraries
#General Library
import pandas as pd
import numpy as np
import seaborn as sns
import matplotlib.pyplot as plt
import matplotlib as mpl
import random
import time

#Path Process
import os
import os.path
from pathlib import Path
import glob
from scipy.io import loadmat
import nibabel as nib
import csv

#For ImAGE Processiong
from PIL import Image
from keras.preprocessing import image
from tensorflow.keras.preprocessing.image import ImageDataGenerator
import cv2
from keras.applications.vgg16 import preprocess_input, decode_predictions
from keras.preprocessing import image
from skimage.feature import hessian_matrix, hessian_matrix_eigvals
from scipy.ndimage.filters import convolve
from skimage import data, io, filters
import skimage
from skimage.morphology import convex_hull_image, erosion
from IPython import display
from scipy.ndimage import gaussian_filter
from mpl_toolkits.mplot3d.art3d import Poly3DCollection
import matplotlib.patches as patches

#For scalling and image transforming
from sklearn.preprocessing import StandardScaler
from sklearn.preprocessing import MinMaxScaler
from keras.utils.np_utils import to_categorical
from sklearn.model_selection import train_test_split
from keras import regularizers
from sklearn.preprocessing import LabelEncoder

#Accuracy Control Testing
from sklearn.metrics import confusion_matrix, accuracy_score, classification_report, roc_auc_score, roc_curve
from sklearn.model_selection import GridSearchCV, cross_val_score
from sklearn.metrics import mean_squared_error, r2_score

#Optimizer
from keras.optimizers import RMSprop,Adam,Optimizer,Optimizer, SGD

#For Layer Modelling
from tensorflow.keras.models import Sequential
from keras.layers import Dense, Dropout, Flatten, Conv2D, MaxPool2D, BatchNormalization,MaxPooling2D,BatchNormalization,\
                        Permute, TimeDistributed, Bidirectional,GRU, SimpleRNN,\
LSTM, GlobalAveragePooling2D, SeparableConv2D, ZeroPadding2D, Convolution2D, ZeroPadding2D,Reshape, Conv2DTranspose,\
LeakyReLU, GaussianNoise, GlobalMaxPooling2D, ReLU, Input, Concatenate
from keras import models
from keras import layers
import tensorflow as tf
from keras.applications import VGG16,VGG19,inception_v3
from keras import backend as K
from keras.utils import plot_model
from keras.datasets import mnist
import keras
from keras.models import Model

#Filter Ignoring
from warnings import filterwarnings
filterwarnings("ignore",category=DeprecationWarning)
filterwarnings("ignore", category=FutureWarning)
filterwarnings("ignore", category=UserWarning)
Overview and Analyst Process
Path
Dir_Path = Path("../input/mukhamad-a/playground/Black_Hole_Real_Simulations")
MOV / MP4
MP4_Path = list(Dir_Path.glob(r"*.mp4"))
MP4_Path.append(Dir_Path.glob(r"*.mov"))
print("LEN VIDEO LIST: ",len(MP4_Path))
LEN VIDEO LIST: 9
Video_Series = pd.Series(MP4_Path,name="VIDEO").astype(str)
print(Video_Series.head(-1))
0    ../input/mukhamad-a/playground...
1    ../input/mukhamad-a/playground...
2    ../input/mukhamad-a/playground...
3    ../input/mukhamad-a/playground...
4    ../input/mukhamad-a/playground...
5    ../input/mukhamad-a/playground...
6    ../input/mukhamad-a/playground...
7    ../input/mukhamad-a/playground...
Name: VIDEO, dtype: object
print(Video_Series[0])
print("---"*10)
print(Video_Series[2])
print("---"*10)
print(Video_Series[7])
../input/mukhamad-a/playground/Black_Hole_Real_Simulations/Accretion Disk.mp4
------------------------------
../input/mukhamad-a/playground/Black_Hole_Real_Simulations/1 mm Wavelength.mp4
------------------------------
../input/mukhamad-a/playground/Black_Hole_Real_Simulations/Accretion Disk_II.mp4
Video Transformation
I will use just Accretion Disk Video, but I want to show how to export all frames.
Total
Black_Hole_Image = []

for file_name in Video_Series:
    Video_File = file_name

    Video_Caption = cv2.VideoCapture(Video_File)

    while Video_Caption.isOpened():

        _,frame = Video_Caption.read()

        if _ != True:
            break

        if Video_Caption.isOpened():

            Transformed_IMG = cv2.cvtColor(frame,cv2.COLOR_BGR2RGB)
            Resized_IMG = cv2.resize(Transformed_IMG,(180,180),interpolation=cv2.INTER_CUBIC)
            Black_Hole_Image.append(Resized_IMG)
print("LEN LIST: ",len(Black_Hole_Image))
print("LEN ARRAY: ",np.shape(np.array(Black_Hole_Image)))
LEN LIST:  7235
LEN ARRAY:  (7235, 180, 180, 3)
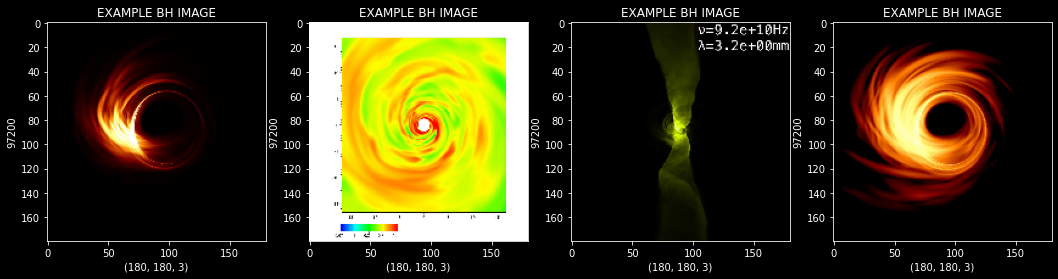
plt.style.use("dark_background")
figure,axis = plt.subplots(1,4,figsize=(18,18))

axis[0].set_xlabel(Black_Hole_Image[0].shape)
axis[0].set_ylabel(Black_Hole_Image[0].size)
axis[0].set_title("EXAMPLE BH IMAGE")
axis[0].imshow(Black_Hole_Image[0])

axis[1].set_xlabel(Black_Hole_Image[567].shape)
axis[1].set_ylabel(Black_Hole_Image[567].size)
axis[1].set_title("EXAMPLE BH IMAGE")
axis[1].imshow(Black_Hole_Image[567])

axis[2].set_xlabel(Black_Hole_Image[3400].shape)
axis[2].set_ylabel(Black_Hole_Image[3400].size)
axis[2].set_title("EXAMPLE BH IMAGE")
axis[2].imshow(Black_Hole_Image[3400])

axis[3].set_xlabel(Black_Hole_Image[7000].shape)
axis[3].set_ylabel(Black_Hole_Image[7000].size)
axis[3].set_title("EXAMPLE BH IMAGE")
axis[3].imshow(Black_Hole_Image[7000])
<matplotlib.image.AxesImage at 0x7fc454f36450>
Specific Capturing
Accretion_Disk_Path = "../input/mukhamad-a/playground/Black_Hole_Real_Simulations/Accretion Disk.mp4"

Acc_List = []

Acc_Video = cv2.VideoCapture(Accretion_Disk_Path)

while Acc_Video.isOpened():

    _,frame = Acc_Video.read()

    if _ != True:
        break

    if Acc_Video.isOpened():

        Transformed_IMG = cv2.cvtColor(frame,cv2.COLOR_BGR2RGB)
        Resized_IMG = cv2.resize(Transformed_IMG,(180,180),interpolation=cv2.INTER_CUBIC)
        Acc_List.append(Resized_IMG)
print("LEN LIST: ",len(Acc_List))
print("LEN ARRAY: ",np.shape(np.array(Acc_List)))
LEN LIST:  513
LEN ARRAY:  (513, 180, 180, 3)
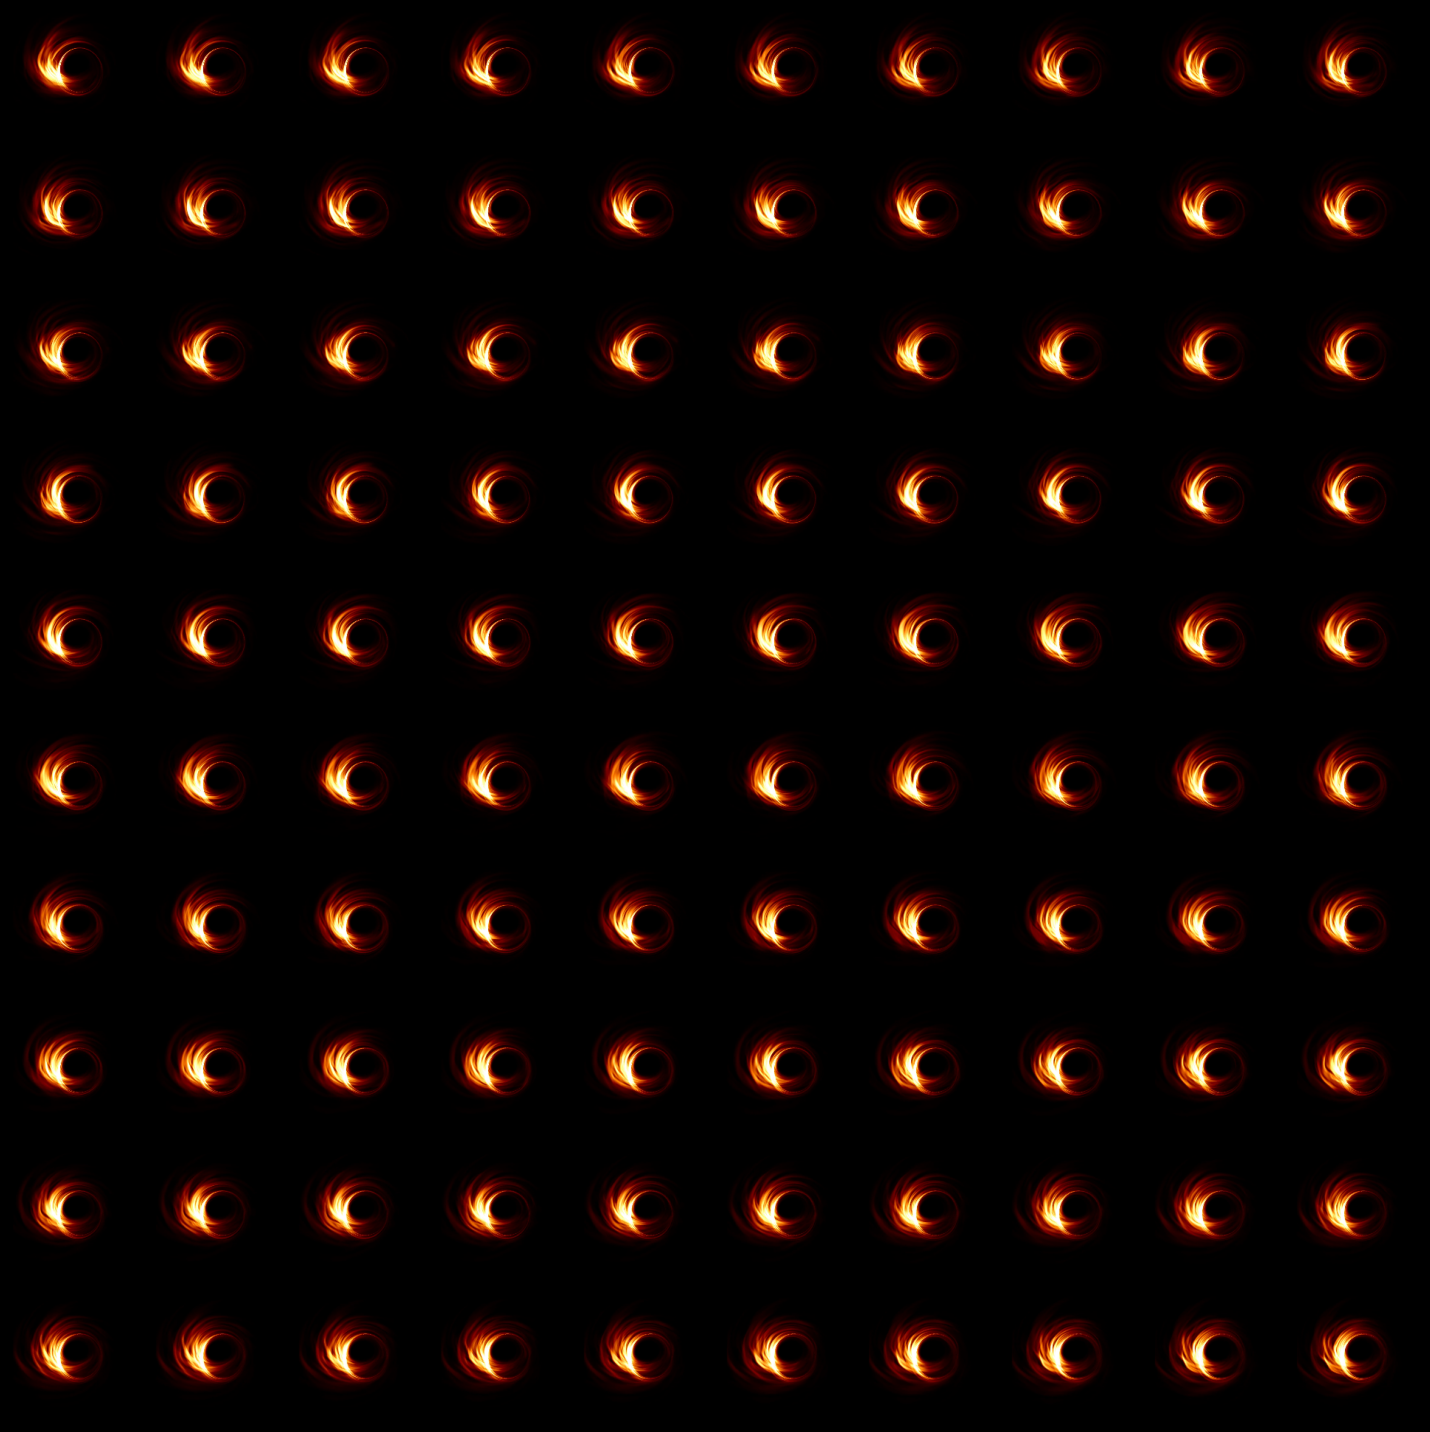
figure,axis = plt.subplots(10,10,figsize=(20,20))

for indexing,operations in enumerate(axis.flat):

    Picking_IMG = Acc_List[indexing*5]

    operations.imshow(Picking_IMG)
    operations.axis("off")

plt.tight_layout()
plt.show()
Analyst
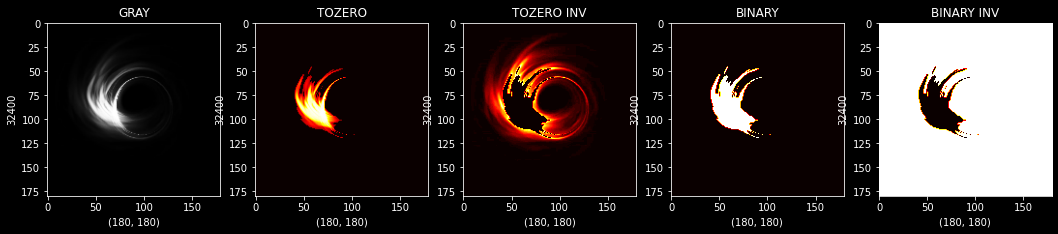
Threshold Type
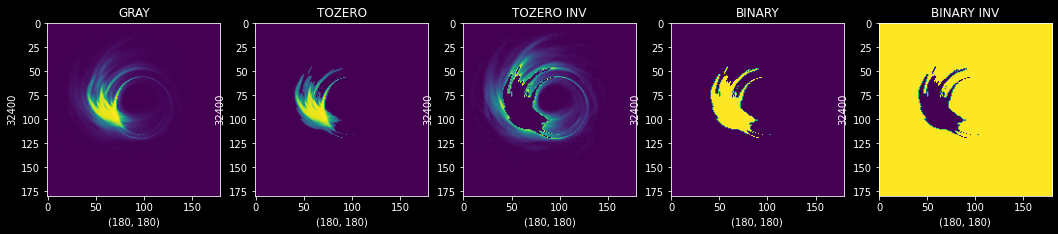
figure,axis = plt.subplots(1,5,figsize=(18,18))
Picking_IMG = Acc_List[1]
Gray_IMG = cv2.cvtColor(Picking_IMG,cv2.COLOR_RGB2GRAY)
_,Threshold_IMG_TOZERO = cv2.threshold(Gray_IMG,55,255,cv2.THRESH_TOZERO)
_,Threshold_IMG_TOZERO_INV = cv2.threshold(Gray_IMG,55,255,cv2.THRESH_TOZERO_INV)
_,Threshold_IMG_BINARY = cv2.threshold(Gray_IMG,55,255,cv2.THRESH_BINARY)
_,Threshold_IMG_BINARY_INV = cv2.threshold(Gray_IMG,55,255,cv2.THRESH_BINARY_INV)

axis[0].set_xlabel(Gray_IMG.shape)
axis[0].set_ylabel(Gray_IMG.size)
axis[0].set_title("GRAY")
axis[0].imshow(Gray_IMG)

axis[1].set_xlabel(Threshold_IMG_TOZERO.shape)
axis[1].set_ylabel(Threshold_IMG_TOZERO.size)
axis[1].set_title("TOZERO")
axis[1].imshow(Threshold_IMG_TOZERO)

axis[2].set_xlabel(Threshold_IMG_TOZERO_INV.shape)
axis[2].set_ylabel(Threshold_IMG_TOZERO_INV.size)
axis[2].set_title("TOZERO INV")
axis[2].imshow(Threshold_IMG_TOZERO_INV)

axis[3].set_xlabel(Threshold_IMG_BINARY.shape)
axis[3].set_ylabel(Threshold_IMG_BINARY.size)
axis[3].set_title("BINARY")
axis[3].imshow(Threshold_IMG_BINARY)

axis[4].set_xlabel(Threshold_IMG_BINARY_INV.shape)
axis[4].set_ylabel(Threshold_IMG_BINARY_INV.size)
axis[4].set_title("BINARY INV")
axis[4].imshow(Threshold_IMG_BINARY_INV)
<matplotlib.image.AxesImage at 0x7fc446697d50>
figure,axis = plt.subplots(1,5,figsize=(18,18))
Picking_IMG = Acc_List[1]
Gray_IMG = cv2.cvtColor(Picking_IMG,cv2.COLOR_RGB2GRAY)
_,Threshold_IMG_TOZERO = cv2.threshold(Gray_IMG,55,255,cv2.THRESH_TOZERO)
_,Threshold_IMG_TOZERO_INV = cv2.threshold(Gray_IMG,55,255,cv2.THRESH_TOZERO_INV)
_,Threshold_IMG_BINARY = cv2.threshold(Gray_IMG,55,255,cv2.THRESH_BINARY)
_,Threshold_IMG_BINARY_INV = cv2.threshold(Gray_IMG,55,255,cv2.THRESH_BINARY_INV)

axis[0].set_xlabel(Gray_IMG.shape)
axis[0].set_ylabel(Gray_IMG.size)
axis[0].set_title("GRAY")
axis[0].imshow(Gray_IMG,cmap="gray")

axis[1].set_xlabel(Threshold_IMG_TOZERO.shape)
axis[1].set_ylabel(Threshold_IMG_TOZERO.size)
axis[1].set_title("TOZERO")
axis[1].imshow(Threshold_IMG_TOZERO,cmap="hot")

axis[2].set_xlabel(Threshold_IMG_TOZERO_INV.shape)
axis[2].set_ylabel(Threshold_IMG_TOZERO_INV.size)
axis[2].set_title("TOZERO INV")
axis[2].imshow(Threshold_IMG_TOZERO_INV,cmap="hot")

axis[3].set_xlabel(Threshold_IMG_BINARY.shape)
axis[3].set_ylabel(Threshold_IMG_BINARY.size)
axis[3].set_title("BINARY")
axis[3].imshow(Threshold_IMG_BINARY,cmap="hot")

axis[4].set_xlabel(Threshold_IMG_BINARY_INV.shape)
axis[4].set_ylabel(Threshold_IMG_BINARY_INV.size)
axis[4].set_title("BINARY INV")
axis[4].imshow(Threshold_IMG_BINARY_INV,cmap="hot")
<matplotlib.image.AxesImage at 0x7fc44647bdd0>
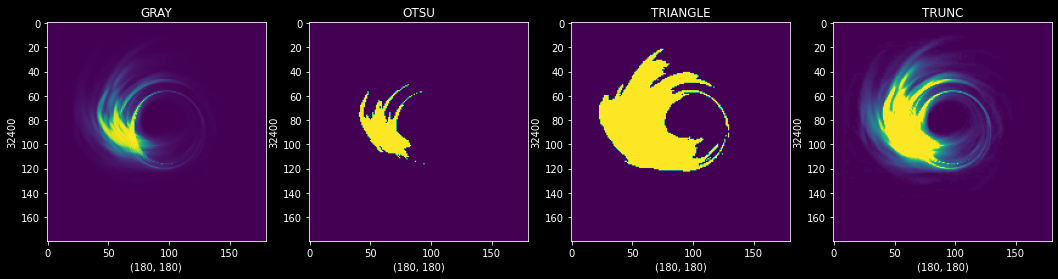
figure,axis = plt.subplots(1,4,figsize=(18,18))
Picking_IMG = Acc_List[1]
Gray_IMG = cv2.cvtColor(Picking_IMG,cv2.COLOR_RGB2GRAY)
_,Threshold_IMG_OTSU = cv2.threshold(Gray_IMG,55,255,cv2.THRESH_OTSU)
_,Threshold_IMG_TRIANGLE = cv2.threshold(Gray_IMG,55,255,cv2.THRESH_TRIANGLE)
_,Threshold_IMG_TRUNC = cv2.threshold(Gray_IMG,55,255,cv2.THRESH_TRUNC)

axis[0].set_xlabel(Gray_IMG.shape)
axis[0].set_ylabel(Gray_IMG.size)
axis[0].set_title("GRAY")
axis[0].imshow(Gray_IMG)

axis[1].set_xlabel(Threshold_IMG_OTSU.shape)
axis[1].set_ylabel(Threshold_IMG_OTSU.size)
axis[1].set_title("OTSU")
axis[1].imshow(Threshold_IMG_OTSU)

axis[2].set_xlabel(Threshold_IMG_TRIANGLE.shape)
axis[2].set_ylabel(Threshold_IMG_TRIANGLE.size)
axis[2].set_title("TRIANGLE")
axis[2].imshow(Threshold_IMG_TRIANGLE)

axis[3].set_xlabel(Threshold_IMG_TRUNC.shape)
axis[3].set_ylabel(Threshold_IMG_TRUNC.size)
axis[3].set_title("TRUNC")
axis[3].imshow(Threshold_IMG_TRUNC)
<matplotlib.image.AxesImage at 0x7fc44620da90>
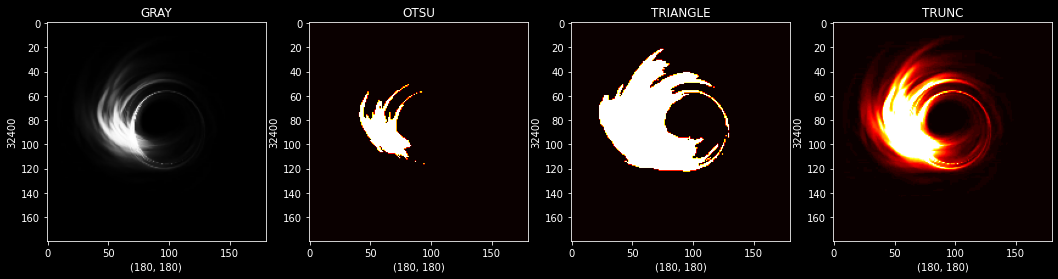
figure,axis = plt.subplots(1,4,figsize=(18,18))
Picking_IMG = Acc_List[1]
Gray_IMG = cv2.cvtColor(Picking_IMG,cv2.COLOR_RGB2GRAY)
_,Threshold_IMG_OTSU = cv2.threshold(Gray_IMG,55,255,cv2.THRESH_OTSU)
_,Threshold_IMG_TRIANGLE = cv2.threshold(Gray_IMG,55,255,cv2.THRESH_TRIANGLE)
_,Threshold_IMG_TRUNC = cv2.threshold(Gray_IMG,55,255,cv2.THRESH_TRUNC)

axis[0].set_xlabel(Gray_IMG.shape)
axis[0].set_ylabel(Gray_IMG.size)
axis[0].set_title("GRAY")
axis[0].imshow(Gray_IMG,cmap="gray")

axis[1].set_xlabel(Threshold_IMG_OTSU.shape)
axis[1].set_ylabel(Threshold_IMG_OTSU.size)
axis[1].set_title("OTSU")
axis[1].imshow(Threshold_IMG_OTSU,cmap="hot")

axis[2].set_xlabel(Threshold_IMG_TRIANGLE.shape)
axis[2].set_ylabel(Threshold_IMG_TRIANGLE.size)
axis[2].set_title("TRIANGLE")
axis[2].imshow(Threshold_IMG_TRIANGLE,cmap="hot")

axis[3].set_xlabel(Threshold_IMG_TRUNC.shape)
axis[3].set_ylabel(Threshold_IMG_TRUNC.size)
axis[3].set_title("TRUNC")
axis[3].imshow(Threshold_IMG_TRUNC,cmap="hot")
<matplotlib.image.AxesImage at 0x7fc44614c290>
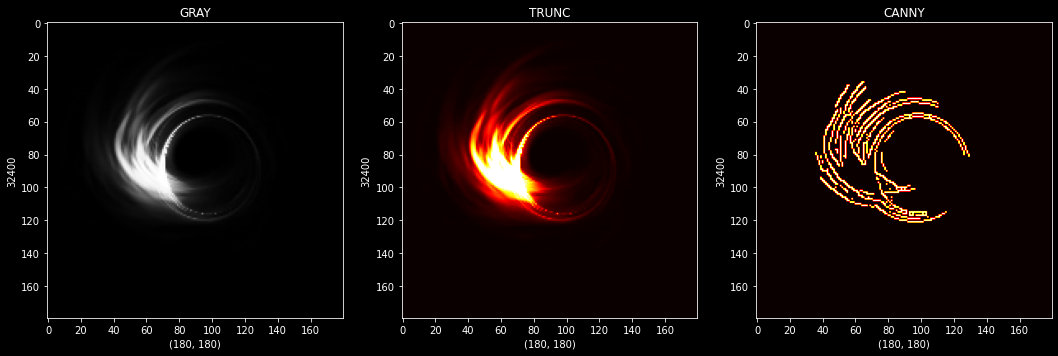
Canny Type
figure,axis = plt.subplots(1,3,figsize=(18,18))
Picking_IMG = Acc_List[1]
Gray_IMG = cv2.cvtColor(Picking_IMG,cv2.COLOR_RGB2GRAY)
_,Threshold_IMG_TRUNC = cv2.threshold(Gray_IMG,220,255,cv2.THRESH_TRUNC)
Canny_IMG = cv2.Canny(Threshold_IMG_TRUNC,55,100)

axis[0].set_xlabel(Gray_IMG.shape)
axis[0].set_ylabel(Gray_IMG.size)
axis[0].set_title("GRAY")
axis[0].imshow(Gray_IMG,cmap="gray")

axis[1].set_xlabel(Threshold_IMG_TRUNC.shape)
axis[1].set_ylabel(Threshold_IMG_TRUNC.size)
axis[1].set_title("TRUNC")
axis[1].imshow(Threshold_IMG_TRUNC,cmap="hot")

axis[2].set_xlabel(Canny_IMG.shape)
axis[2].set_ylabel(Canny_IMG.size)
axis[2].set_title("CANNY")
axis[2].imshow(Canny_IMG,cmap="hot")
<matplotlib.image.AxesImage at 0x7fc445f7f150>
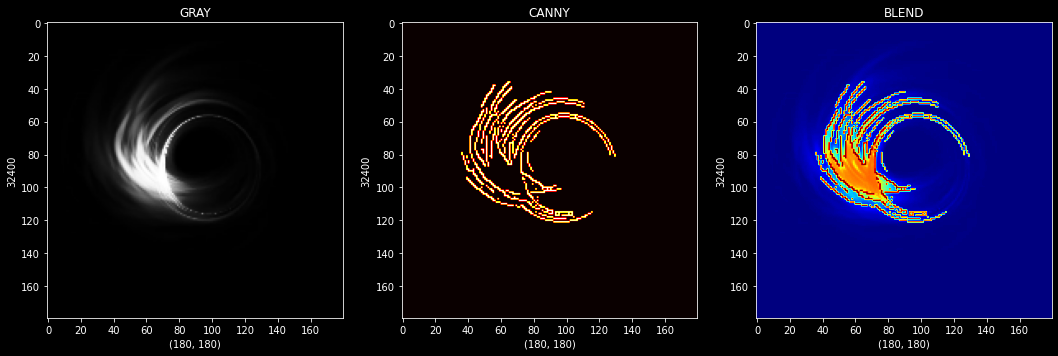
figure,axis = plt.subplots(1,3,figsize=(18,18))
Picking_IMG = Acc_List[1]
Gray_IMG = cv2.cvtColor(Picking_IMG,cv2.COLOR_RGB2GRAY)
_,Threshold_IMG_TRUNC = cv2.threshold(Gray_IMG,220,255,cv2.THRESH_TRUNC)
Canny_IMG = cv2.Canny(Threshold_IMG_TRUNC,55,100)
Blend_IMG = cv2.addWeighted(Gray_IMG,0.8,Canny_IMG,0.8,0.1)

axis[0].set_xlabel(Gray_IMG.shape)
axis[0].set_ylabel(Gray_IMG.size)
axis[0].set_title("GRAY")
axis[0].imshow(Gray_IMG,cmap="gray")

axis[1].set_xlabel(Canny_IMG.shape)
axis[1].set_ylabel(Canny_IMG.size)
axis[1].set_title("CANNY")
axis[1].imshow(Canny_IMG,cmap="hot")

axis[2].set_xlabel(Blend_IMG.shape)
axis[2].set_ylabel(Blend_IMG.size)
axis[2].set_title("BLEND")
axis[2].imshow(Blend_IMG,cmap="jet")
<matplotlib.image.AxesImage at 0x7fc445cc0e90>
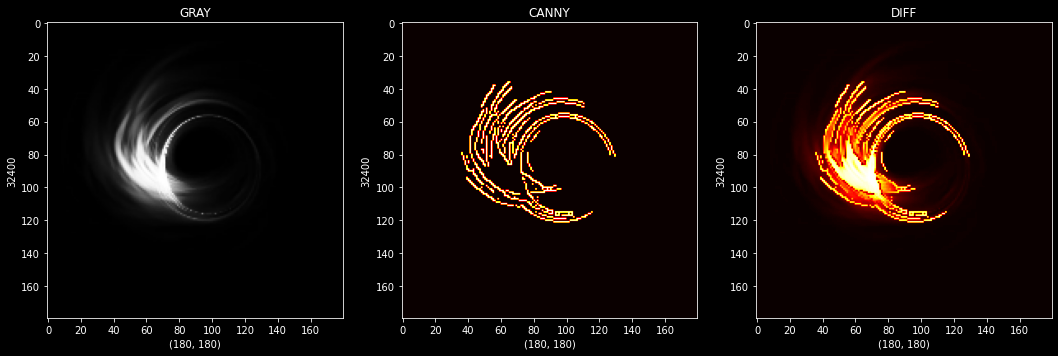
figure,axis = plt.subplots(1,3,figsize=(18,18))
Picking_IMG = Acc_List[1]
Gray_IMG = cv2.cvtColor(Picking_IMG,cv2.COLOR_RGB2GRAY)
_,Threshold_IMG_TRUNC = cv2.threshold(Gray_IMG,220,255,cv2.THRESH_TRUNC)
Canny_IMG = cv2.Canny(Threshold_IMG_TRUNC,55,100)
Diff_Image = cv2.absdiff(Gray_IMG,Canny_IMG,np.zeros((2,2)))

axis[0].set_xlabel(Gray_IMG.shape)
axis[0].set_ylabel(Gray_IMG.size)
axis[0].set_title("GRAY")
axis[0].imshow(Gray_IMG,cmap="gray")

axis[1].set_xlabel(Canny_IMG.shape)
axis[1].set_ylabel(Canny_IMG.size)
axis[1].set_title("CANNY")
axis[1].imshow(Canny_IMG,cmap="hot")

axis[2].set_xlabel(Diff_Image.shape)
axis[2].set_ylabel(Diff_Image.size)
axis[2].set_title("DIFF")
axis[2].imshow(Diff_Image,cmap="hot")
<matplotlib.image.AxesImage at 0x7fc445b74850>
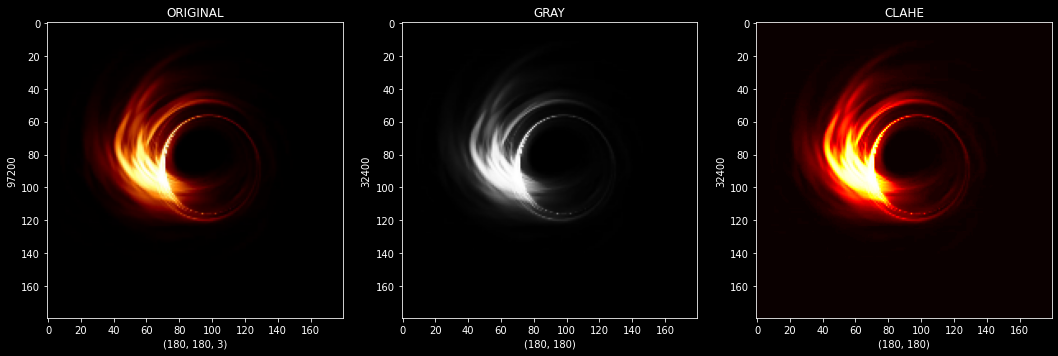
Equalyze Histogram
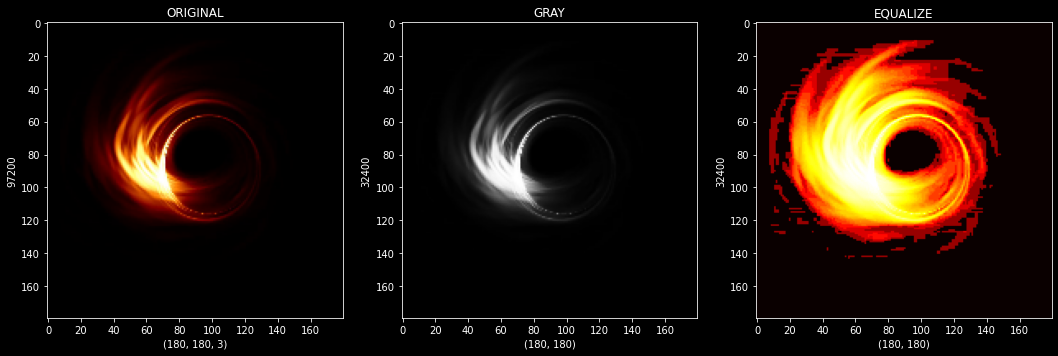
figure,axis = plt.subplots(1,3,figsize=(18,18))
Picking_IMG = Acc_List[1]
Gray_IMG = cv2.cvtColor(Picking_IMG,cv2.COLOR_RGB2GRAY)
Equalize_IMG = cv2.equalizeHist(Gray_IMG)

axis[0].set_xlabel(Picking_IMG.shape)
axis[0].set_ylabel(Picking_IMG.size)
axis[0].set_title("ORIGINAL")
axis[0].imshow(Picking_IMG,cmap="gray")

axis[1].set_xlabel(Gray_IMG.shape)
axis[1].set_ylabel(Gray_IMG.size)
axis[1].set_title("GRAY")
axis[1].imshow(Gray_IMG,cmap="gray")

axis[2].set_xlabel(Equalize_IMG.shape)
axis[2].set_ylabel(Equalize_IMG.size)
axis[2].set_title("EQUALIZE")
axis[2].imshow(Equalize_IMG,cmap="hot")
<matplotlib.image.AxesImage at 0x7fc4459ae190>
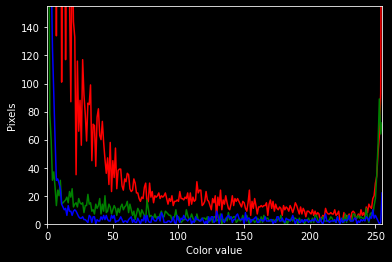
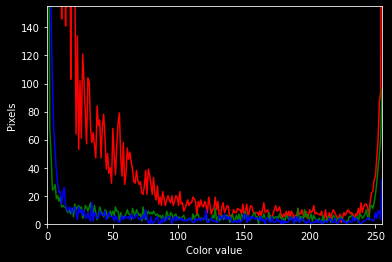
Single_Image = Acc_List[1]

colors = ("red", "green", "blue")
channel_dim = (0, 1, 2)

plt.xlim([0, 255])
plt.ylim([0, 155])

for channel_id, c in zip(channel_dim, colors):
    histogram, bin_edges = np.histogram(
    Single_Image[:, :, channel_id], bins=256, range=(0, 256))
    plt.plot(bin_edges[0:-1], histogram, color=c)

plt.xlabel("Color value")
plt.ylabel("Pixels")
Text(0, 0.5, 'Pixels')
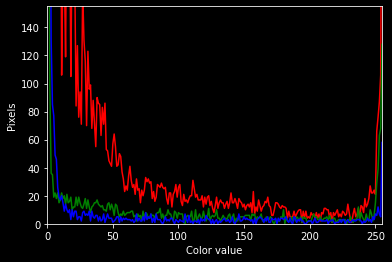
Single_Image = Acc_List[100]

colors = ("red", "green", "blue")
channel_dim = (0, 1, 2)

plt.xlim([0, 255])
plt.ylim([0, 155])

for channel_id, c in zip(channel_dim, colors):
    histogram, bin_edges = np.histogram(
    Single_Image[:, :, channel_id], bins=256, range=(0, 256))
    plt.plot(bin_edges[0:-1], histogram, color=c)

plt.xlabel("Color value")
plt.ylabel("Pixels")
Text(0, 0.5, 'Pixels')
Single_Image = Acc_List[433]

colors = ("red", "green", "blue")
channel_dim = (0, 1, 2)

plt.xlim([0, 255])
plt.ylim([0, 155])

for channel_id, c in zip(channel_dim, colors):
    histogram, bin_edges = np.histogram(
    Single_Image[:, :, channel_id], bins=256, range=(0, 256))
    plt.plot(bin_edges[0:-1], histogram, color=c)

plt.xlabel("Color value")
plt.ylabel("Pixels")
Text(0, 0.5, 'Pixels')
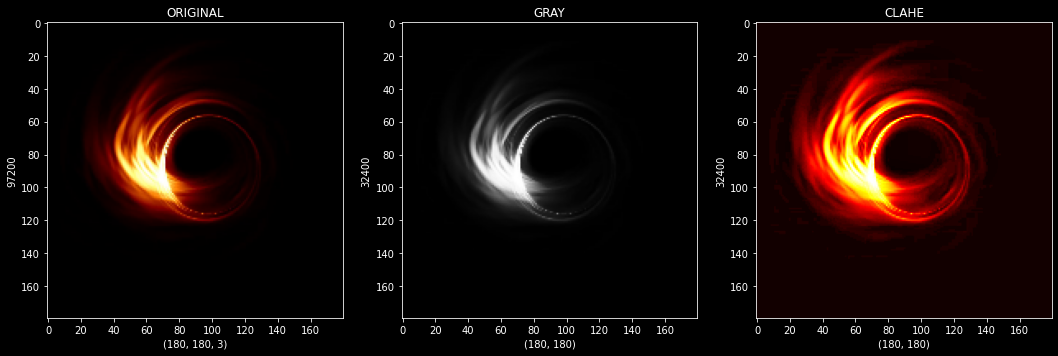
Clahe Type
figure,axis = plt.subplots(1,3,figsize=(18,18))
Picking_IMG = Acc_List[1]
Gray_IMG = cv2.cvtColor(Picking_IMG,cv2.COLOR_RGB2GRAY)

Clahe_Func = cv2.createCLAHE(clipLimit=5.0,tileGridSize=(8,8))
Apply_Clahe = Clahe_Func.apply(Gray_IMG)

axis[0].set_xlabel(Picking_IMG.shape)
axis[0].set_ylabel(Picking_IMG.size)
axis[0].set_title("ORIGINAL")
axis[0].imshow(Picking_IMG,cmap="gray")

axis[1].set_xlabel(Gray_IMG.shape)
axis[1].set_ylabel(Gray_IMG.size)
axis[1].set_title("GRAY")
axis[1].imshow(Gray_IMG,cmap="gray")

axis[2].set_xlabel(Apply_Clahe.shape)
axis[2].set_ylabel(Apply_Clahe.size)
axis[2].set_title("CLAHE")
axis[2].imshow(Apply_Clahe,cmap="hot")
<matplotlib.image.AxesImage at 0x7fc44566a090>
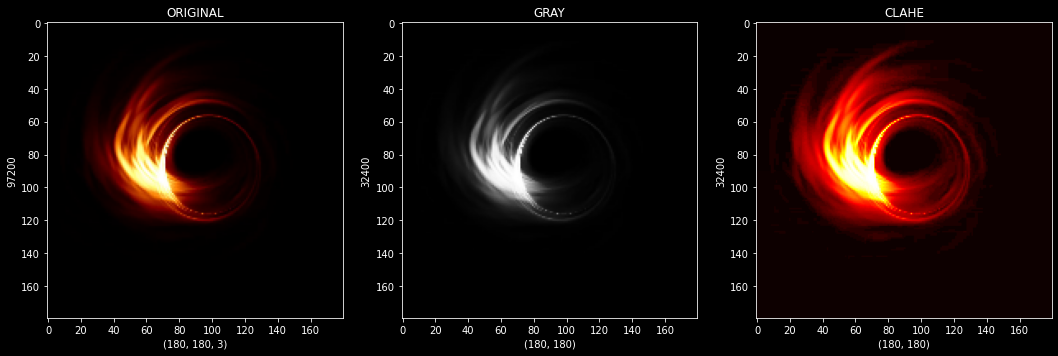
figure,axis = plt.subplots(1,3,figsize=(18,18))
Picking_IMG = Acc_List[1]
Gray_IMG = cv2.cvtColor(Picking_IMG,cv2.COLOR_RGB2GRAY)

Clahe_Func = cv2.createCLAHE(clipLimit=5.0,tileGridSize=(2,2))
Apply_Clahe = Clahe_Func.apply(Gray_IMG)

axis[0].set_xlabel(Picking_IMG.shape)
axis[0].set_ylabel(Picking_IMG.size)
axis[0].set_title("ORIGINAL")
axis[0].imshow(Picking_IMG,cmap="gray")

axis[1].set_xlabel(Gray_IMG.shape)
axis[1].set_ylabel(Gray_IMG.size)
axis[1].set_title("GRAY")
axis[1].imshow(Gray_IMG,cmap="gray")

axis[2].set_xlabel(Apply_Clahe.shape)
axis[2].set_ylabel(Apply_Clahe.size)
axis[2].set_title("CLAHE")
axis[2].imshow(Apply_Clahe,cmap="hot")
<matplotlib.image.AxesImage at 0x7fc44549d490>
figure,axis = plt.subplots(1,3,figsize=(18,18))
Picking_IMG = Acc_List[1]
Gray_IMG = cv2.cvtColor(Picking_IMG,cv2.COLOR_RGB2GRAY)

Clahe_Func = cv2.createCLAHE(clipLimit=1.0,tileGridSize=(2,2))
Apply_Clahe = Clahe_Func.apply(Gray_IMG)

axis[0].set_xlabel(Picking_IMG.shape)
axis[0].set_ylabel(Picking_IMG.size)
axis[0].set_title("ORIGINAL")
axis[0].imshow(Picking_IMG,cmap="gray")

axis[1].set_xlabel(Gray_IMG.shape)
axis[1].set_ylabel(Gray_IMG.size)
axis[1].set_title("GRAY")
axis[1].imshow(Gray_IMG,cmap="gray")

axis[2].set_xlabel(Apply_Clahe.shape)
axis[2].set_ylabel(Apply_Clahe.size)
axis[2].set_title("CLAHE")
axis[2].imshow(Apply_Clahe,cmap="hot")
<matplotlib.image.AxesImage at 0x7fc44532de10>
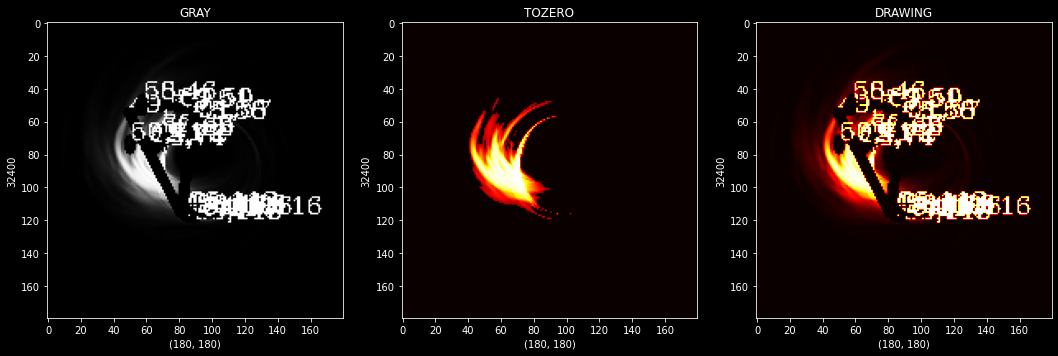
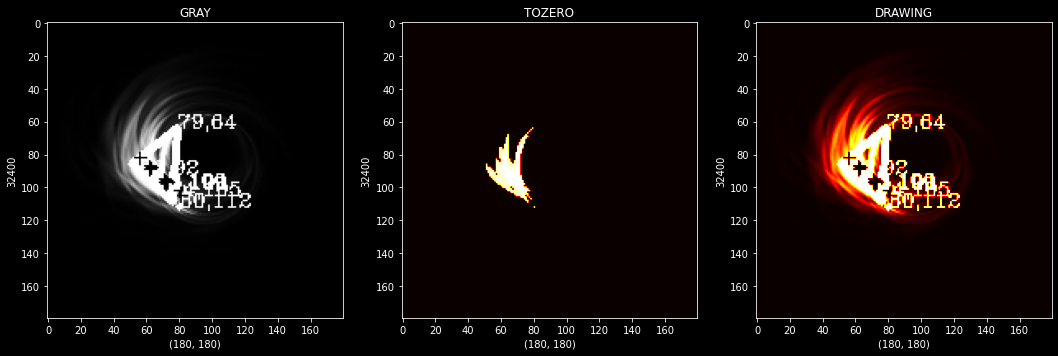
Contours and PolyDP
figure,axis = plt.subplots(1,3,figsize=(18,18))
Picking_IMG = Acc_List[1]
Gray_IMG = cv2.cvtColor(Picking_IMG,cv2.COLOR_RGB2GRAY)
_,Threshold_IMG_TOZERO = cv2.threshold(Gray_IMG,55,255,cv2.THRESH_TOZERO)
Contours,_ = cv2.findContours(Threshold_IMG_TOZERO,cv2.RETR_TREE,cv2.CHAIN_APPROX_SIMPLE)

for cnt in Contours:

    approx = cv2.approxPolyDP(cnt,0.09*cv2.arcLength(cnt,True),True)

    Drawing_Contour = cv2.drawContours(Gray_IMG,[approx],0,(0,255,0),5)

    n_count = approx.ravel()
    i = 0

    for j in n_count:
        if (i % 2 == 0):
            x = n_count[i]
            y = n_count[i + 1]

            string_coor = str(x) + " " + str(y)

            if (i == 0):
                cv2.putText(Gray_IMG,f"{x},{y}",(x,y),cv2.FONT_HERSHEY_COMPLEX,0.5,(255,0,255))
            else:
                cv2.putText(Gray_IMG,"+",(x,y),cv2.FONT_HERSHEY_COMPLEX,0.5,(0,0,255))

        i = i + 1


axis[0].set_xlabel(Gray_IMG.shape)
axis[0].set_ylabel(Gray_IMG.size)
axis[0].set_title("GRAY")
axis[0].imshow(Gray_IMG,cmap="gray")

axis[1].set_xlabel(Threshold_IMG_TOZERO.shape)
axis[1].set_ylabel(Threshold_IMG_TOZERO.size)
axis[1].set_title("TOZERO")
axis[1].imshow(Threshold_IMG_TOZERO,cmap="hot")

axis[2].set_xlabel(Drawing_Contour.shape)
axis[2].set_ylabel(Drawing_Contour.size)
axis[2].set_title("DRAWING")
axis[2].imshow(Drawing_Contour,cmap="hot")
<matplotlib.image.AxesImage at 0x7fc44517ffd0>
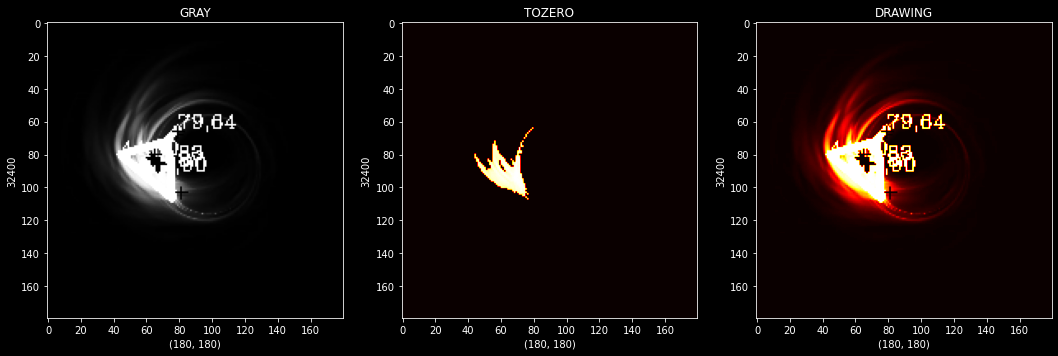
figure,axis = plt.subplots(1,3,figsize=(18,18))
Picking_IMG = Acc_List[1]
Gray_IMG = cv2.cvtColor(Picking_IMG,cv2.COLOR_RGB2GRAY)
_,Threshold_IMG_TOZERO = cv2.threshold(Gray_IMG,220,255,cv2.THRESH_TOZERO)
Contours,_ = cv2.findContours(Threshold_IMG_TOZERO,cv2.RETR_TREE,cv2.CHAIN_APPROX_SIMPLE)

for cnt in Contours:

    approx = cv2.approxPolyDP(cnt,0.09*cv2.arcLength(cnt,True),True)

    Drawing_Contour = cv2.drawContours(Gray_IMG,[approx],0,(255,255,0),3)

    n_count = approx.ravel()
    i = 0

    for j in n_count:
        if (i % 2 == 0):
            x = n_count[i]
            y = n_count[i + 1]

            string_coor = str(x) + " " + str(y)

            if (i == 0):
                cv2.putText(Gray_IMG,f"{x},{y}",(x,y),cv2.FONT_HERSHEY_COMPLEX,0.4,(255,0,255))
            else:
                cv2.putText(Gray_IMG,"+",(x,y),cv2.FONT_HERSHEY_COMPLEX,0.4,(0,0,255))

        i = i + 1


axis[0].set_xlabel(Gray_IMG.shape)
axis[0].set_ylabel(Gray_IMG.size)
axis[0].set_title("GRAY")
axis[0].imshow(Gray_IMG,cmap="gray")

axis[1].set_xlabel(Threshold_IMG_TOZERO.shape)
axis[1].set_ylabel(Threshold_IMG_TOZERO.size)
axis[1].set_title("TOZERO")
axis[1].imshow(Threshold_IMG_TOZERO,cmap="hot")

axis[2].set_xlabel(Drawing_Contour.shape)
axis[2].set_ylabel(Drawing_Contour.size)
axis[2].set_title("DRAWING")
axis[2].imshow(Drawing_Contour,cmap="hot")
<matplotlib.image.AxesImage at 0x7fc44506a710>
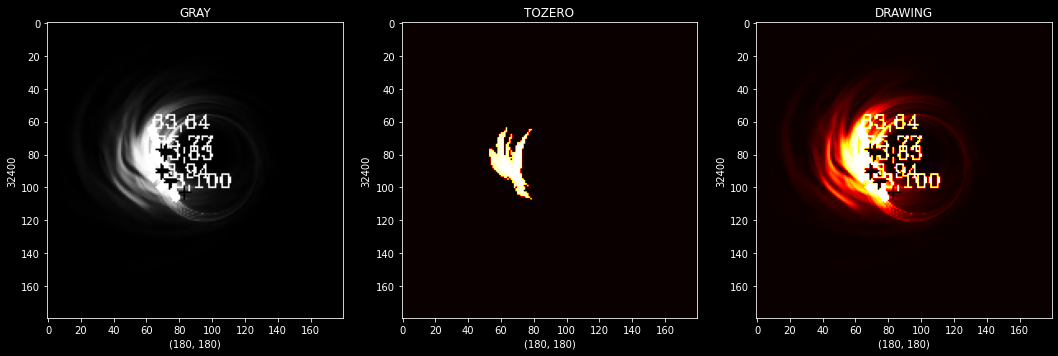
figure,axis = plt.subplots(1,3,figsize=(18,18))
Picking_IMG = Acc_List[400]
Gray_IMG = cv2.cvtColor(Picking_IMG,cv2.COLOR_RGB2GRAY)
_,Threshold_IMG_TOZERO = cv2.threshold(Gray_IMG,220,255,cv2.THRESH_TOZERO)
Contours,_ = cv2.findContours(Threshold_IMG_TOZERO,cv2.RETR_TREE,cv2.CHAIN_APPROX_SIMPLE)

for cnt in Contours:

    approx = cv2.approxPolyDP(cnt,0.09*cv2.arcLength(cnt,True),True)

    Drawing_Contour = cv2.drawContours(Gray_IMG,[approx],0,(255,255,0),3)

    n_count = approx.ravel()
    i = 0

    for j in n_count:
        if (i % 2 == 0):
            x = n_count[i]
            y = n_count[i + 1]

            string_coor = str(x) + " " + str(y)

            if (i == 0):
                cv2.putText(Gray_IMG,f"{x},{y}",(x,y),cv2.FONT_HERSHEY_COMPLEX,0.4,(255,0,255))
            else:
                cv2.putText(Gray_IMG,"+",(x,y),cv2.FONT_HERSHEY_COMPLEX,0.4,(0,0,255))

        i = i + 1


axis[0].set_xlabel(Gray_IMG.shape)
axis[0].set_ylabel(Gray_IMG.size)
axis[0].set_title("GRAY")
axis[0].imshow(Gray_IMG,cmap="gray")

axis[1].set_xlabel(Threshold_IMG_TOZERO.shape)
axis[1].set_ylabel(Threshold_IMG_TOZERO.size)
axis[1].set_title("TOZERO")
axis[1].imshow(Threshold_IMG_TOZERO,cmap="hot")

axis[2].set_xlabel(Drawing_Contour.shape)
axis[2].set_ylabel(Drawing_Contour.size)
axis[2].set_title("DRAWING")
axis[2].imshow(Drawing_Contour,cmap="hot")
<matplotlib.image.AxesImage at 0x7fc444de1650>
figure,axis = plt.subplots(1,3,figsize=(18,18))
Picking_IMG = Acc_List[277]
Gray_IMG = cv2.cvtColor(Picking_IMG,cv2.COLOR_RGB2GRAY)
_,Threshold_IMG_TOZERO = cv2.threshold(Gray_IMG,220,255,cv2.THRESH_TOZERO)
Contours,_ = cv2.findContours(Threshold_IMG_TOZERO,cv2.RETR_TREE,cv2.CHAIN_APPROX_SIMPLE)

for cnt in Contours:

    approx = cv2.approxPolyDP(cnt,0.09*cv2.arcLength(cnt,True),True)

    Drawing_Contour = cv2.drawContours(Gray_IMG,[approx],0,(255,255,0),3)

    n_count = approx.ravel()
    i = 0

    for j in n_count:
        if (i % 2 == 0):
            x = n_count[i]
            y = n_count[i + 1]

            string_coor = str(x) + " " + str(y)

            if (i == 0):
                cv2.putText(Gray_IMG,f"{x},{y}",(x,y),cv2.FONT_HERSHEY_COMPLEX,0.4,(255,0,255))
            else:
                cv2.putText(Gray_IMG,"+",(x,y),cv2.FONT_HERSHEY_COMPLEX,0.4,(0,0,255))

        i = i + 1


axis[0].set_xlabel(Gray_IMG.shape)
axis[0].set_ylabel(Gray_IMG.size)
axis[0].set_title("GRAY")
axis[0].imshow(Gray_IMG,cmap="gray")

axis[1].set_xlabel(Threshold_IMG_TOZERO.shape)
axis[1].set_ylabel(Threshold_IMG_TOZERO.size)
axis[1].set_title("TOZERO")
axis[1].imshow(Threshold_IMG_TOZERO,cmap="hot")

axis[2].set_xlabel(Drawing_Contour.shape)
axis[2].set_ylabel(Drawing_Contour.size)
axis[2].set_title("DRAWING")
axis[2].imshow(Drawing_Contour,cmap="hot")
<matplotlib.image.AxesImage at 0x7fc444c62850>
Approximation Overview and Process
Picking_IMG = Acc_List[277]
Gray_IMG = cv2.cvtColor(Picking_IMG,cv2.COLOR_RGB2GRAY)
_,Threshold_IMG_TOZERO = cv2.threshold(Gray_IMG,220,255,cv2.THRESH_TOZERO)
Contours,_ = cv2.findContours(Threshold_IMG_TOZERO,cv2.RETR_TREE,cv2.CHAIN_APPROX_SIMPLE)

for cnt in Contours:

    approx = cv2.approxPolyDP(cnt,0.09*cv2.arcLength(cnt,True),True)

    Drawing_Contour = cv2.drawContours(Gray_IMG,[approx],0,(255,255,0),3)

    n_count = approx.ravel()
    i = 0

    for j in n_count:
        if (i % 2 == 0):
            x = n_count[i]
            y = n_count[i + 1]

            string_coor = str(x) + " " + str(y)
print(n_count)
print("--"*10)
print(n_count.shape)
print("--"*10)
[56 92 57 91 58 92 57 93]
--------------------
(8,)
--------------------
Reshaped_N = n_count.reshape(4,2)

print(Reshaped_N)
print("--"*10)
print(Reshaped_N.shape)
print("--"*10)
[[56 92]
 [57 91]
 [58 92]
 [57 93]]
--------------------
(4, 2)
--------------------
print(string_coor)
56 92
print("X: ",x)
print("Y: ",y)
X:  56
Y:  92
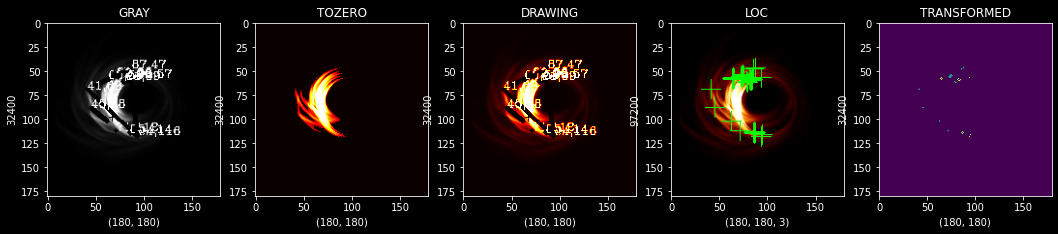
Transforming Coordinates / Measuring the Distance Between Singularity Point and Spiral Arms
Here is the main process of this simulation.
figure,axis = plt.subplots(1,4,figsize=(18,18))

Picking_IMG = Acc_List[2]
Gray_IMG = cv2.cvtColor(Picking_IMG,cv2.COLOR_RGB2GRAY)
_,Threshold_IMG_TOZERO = cv2.threshold(Gray_IMG,220,255,cv2.THRESH_TOZERO)
Contours,_ = cv2.findContours(Threshold_IMG_TOZERO,cv2.RETR_TREE,cv2.CHAIN_APPROX_SIMPLE)


Copy_Main_IMG = Picking_IMG.copy()
Trans_Empty_Zeros = np.zeros((Copy_Main_IMG.shape[0],Copy_Main_IMG.shape[1]),dtype=np.float32)

Total_Approx = []

for cnt in Contours:

    approx = cv2.approxPolyDP(cnt,0.09*cv2.arcLength(cnt,True),True)

    Drawing_Contour = cv2.drawContours(Gray_IMG,[approx],0,(255,255,0),3)

    n_count = approx.ravel()
    i = 0

    for x_cor in n_count:
        x_cor = int(x_cor)
        Marker_IMG = cv2.drawMarker(Copy_Main_IMG,(x_cor,int(Copy_Main_IMG.shape[1]/2)),(255,0,255),thickness=1)

    print(n_count)
    Total_Approx.append(n_count)

    for j in n_count:
        if (i % 2 == 0):
            x = n_count[i]
            y = n_count[i + 1]

            string_coor = str(x) + " " + str(y)

            if (i == 0):
                cv2.putText(Gray_IMG,f"{x},{y}",(x,y),cv2.FONT_HERSHEY_COMPLEX,0.4,(255,0,255))
            else:
                cv2.putText(Gray_IMG,"+",(x,y),cv2.FONT_HERSHEY_COMPLEX,0.4,(0,0,255))

        i = i + 1


axis[0].set_xlabel(Gray_IMG.shape)
axis[0].set_ylabel(Gray_IMG.size)
axis[0].set_title("GRAY")
axis[0].imshow(Gray_IMG,cmap="gray")

axis[1].set_xlabel(Threshold_IMG_TOZERO.shape)
axis[1].set_ylabel(Threshold_IMG_TOZERO.size)
axis[1].set_title("TOZERO")
axis[1].imshow(Threshold_IMG_TOZERO,cmap="hot")

axis[2].set_xlabel(Drawing_Contour.shape)
axis[2].set_ylabel(Drawing_Contour.size)
axis[2].set_title("DRAWING")
axis[2].imshow(Drawing_Contour,cmap="hot")

axis[3].set_xlabel(Marker_IMG.shape)
axis[3].set_ylabel(Marker_IMG.size)
axis[3].set_title("LOC")
axis[3].imshow(Marker_IMG)
[ 44  81  76 107  73  72]
[61 90 62 89 63 90 62 91]
[60 89 61 88 62 89 61 90]
[59 87 60 86 61 88 60 89]
[58 85 59 84 60 86 59 87]
[80 63 74 70]


<matplotlib.image.AxesImage at 0x7fc404e21ed0>
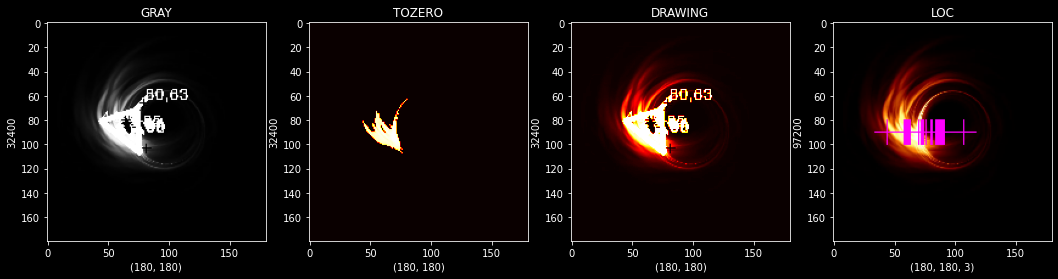
The distribution of the black hole can be observed depending on the distance between the lines
print("TOTAL ARRAY SHAPE: ",np.shape(np.array(Total_Approx)))
TOTAL ARRAY SHAPE: (6,)
Array_Approx = np.array(Total_Approx)
print(Total_Approx)
[array([ 80, 112], dtype=int32), array([ 79, 64, 51, 86, 76, 109], dtype=int32), array([ 74, 105, 75, 104, 76, 105, 75, 106], dtype=int32), array([ 66, 101, 67, 100, 68, 101, 67, 102], dtype=int32), array([ 65, 100, 66, 99, 67, 100, 66, 101], dtype=int32), array([56, 92, 57, 91, 58, 92, 57, 93], dtype=int32)]
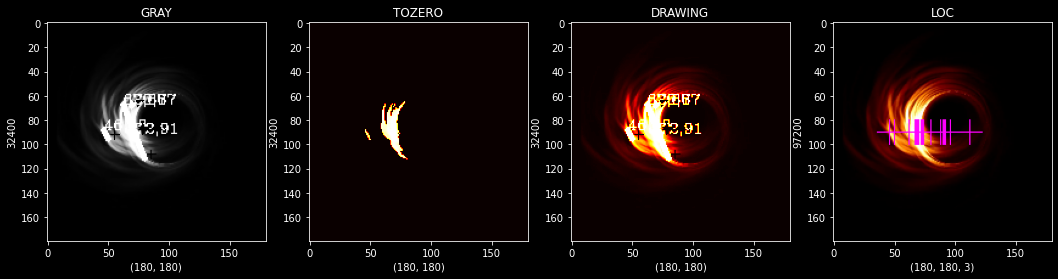
figure,axis = plt.subplots(1,4,figsize=(18,18))

Picking_IMG = Acc_List[488]
Gray_IMG = cv2.cvtColor(Picking_IMG,cv2.COLOR_RGB2GRAY)
_,Threshold_IMG_TOZERO = cv2.threshold(Gray_IMG,220,255,cv2.THRESH_TOZERO)
Contours,_ = cv2.findContours(Threshold_IMG_TOZERO,cv2.RETR_TREE,cv2.CHAIN_APPROX_SIMPLE)


Copy_Main_IMG = Picking_IMG.copy()
Trans_Empty_Zeros = np.zeros((Copy_Main_IMG.shape[0],Copy_Main_IMG.shape[1]),dtype=np.float32)


for cnt in Contours:

    approx = cv2.approxPolyDP(cnt,0.09*cv2.arcLength(cnt,True),True)

    Drawing_Contour = cv2.drawContours(Gray_IMG,[approx],0,(255,255,0),3)

    n_count = approx.ravel()
    i = 0

    for x_cor in n_count:
        x_cor = int(x_cor)
        Marker_IMG = cv2.drawMarker(Copy_Main_IMG,(x_cor,int(Copy_Main_IMG.shape[1]/2)),(255,0,255),thickness=1)

    print(n_count)

    for j in n_count:
        if (i % 2 == 0):
            x = n_count[i]
            y = n_count[i + 1]

            string_coor = str(x) + " " + str(y)

            if (i == 0):
                cv2.putText(Gray_IMG,f"{x},{y}",(x,y),cv2.FONT_HERSHEY_COMPLEX,0.4,(255,0,255))
            else:
                cv2.putText(Gray_IMG,"+",(x,y),cv2.FONT_HERSHEY_COMPLEX,0.4,(0,0,255))

        i = i + 1


axis[0].set_xlabel(Gray_IMG.shape)
axis[0].set_ylabel(Gray_IMG.size)
axis[0].set_title("GRAY")
axis[0].imshow(Gray_IMG,cmap="gray")

axis[1].set_xlabel(Threshold_IMG_TOZERO.shape)
axis[1].set_ylabel(Threshold_IMG_TOZERO.size)
axis[1].set_title("TOZERO")
axis[1].imshow(Threshold_IMG_TOZERO,cmap="hot")

axis[2].set_xlabel(Drawing_Contour.shape)
axis[2].set_ylabel(Drawing_Contour.size)
axis[2].set_title("DRAWING")
axis[2].imshow(Drawing_Contour,cmap="hot")

axis[3].set_xlabel(Marker_IMG.shape)
axis[3].set_ylabel(Marker_IMG.size)
axis[3].set_title("LOC")
axis[3].imshow(Marker_IMG)
[46 88 50 96]
[70 67 70 68 69 69 70 68]
[ 62  67  80 112]
[72 91 73 90 74 91 73 92]


<matplotlib.image.AxesImage at 0x7fc404c13dd0>
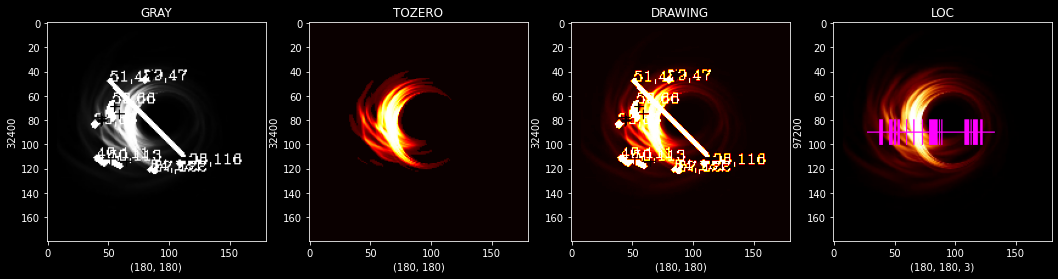
figure,axis = plt.subplots(1,4,figsize=(18,18))

Picking_IMG = Acc_List[510]
Gray_IMG = cv2.cvtColor(Picking_IMG,cv2.COLOR_RGB2GRAY)
_,Threshold_IMG_TOZERO = cv2.threshold(Gray_IMG,20,255,cv2.THRESH_TOZERO)
Contours,_ = cv2.findContours(Threshold_IMG_TOZERO,cv2.RETR_TREE,cv2.CHAIN_APPROX_SIMPLE)


Copy_Main_IMG = Picking_IMG.copy()
Trans_Empty_Zeros = np.zeros((Copy_Main_IMG.shape[0],Copy_Main_IMG.shape[1]),dtype=np.float32)


for cnt in Contours:

    approx = cv2.approxPolyDP(cnt,0.09*cv2.arcLength(cnt,True),True)

    Drawing_Contour = cv2.drawContours(Gray_IMG,[approx],0,(255,255,0),3)

    n_count = approx.ravel()
    i = 0

    for x_cor in n_count:
        x_cor = int(x_cor)
        Marker_IMG = cv2.drawMarker(Copy_Main_IMG,(x_cor,int(Copy_Main_IMG.shape[1]/2)),(255,0,255),thickness=1)

    for j in n_count:
        if (i % 2 == 0):
            x = n_count[i]
            y = n_count[i + 1]

            string_coor = str(x) + " " + str(y)

            if (i == 0):
                cv2.putText(Gray_IMG,f"{x},{y}",(x,y),cv2.FONT_HERSHEY_COMPLEX,0.4,(255,0,255))
            else:
                cv2.putText(Gray_IMG,"+",(x,y),cv2.FONT_HERSHEY_COMPLEX,0.4,(0,0,255))

        i = i + 1


axis[0].set_xlabel(Gray_IMG.shape)
axis[0].set_ylabel(Gray_IMG.size)
axis[0].set_title("GRAY")
axis[0].imshow(Gray_IMG,cmap="gray")

axis[1].set_xlabel(Threshold_IMG_TOZERO.shape)
axis[1].set_ylabel(Threshold_IMG_TOZERO.size)
axis[1].set_title("TOZERO")
axis[1].imshow(Threshold_IMG_TOZERO,cmap="hot")

axis[2].set_xlabel(Drawing_Contour.shape)
axis[2].set_ylabel(Drawing_Contour.size)
axis[2].set_title("DRAWING")
axis[2].imshow(Drawing_Contour,cmap="hot")

axis[3].set_xlabel(Marker_IMG.shape)
axis[3].set_ylabel(Marker_IMG.size)
axis[3].set_title("LOC")
axis[3].imshow(Marker_IMG)
<matplotlib.image.AxesImage at 0x7fc40363bbd0>
figure,axis = plt.subplots(1,5,figsize=(18,18))

Picking_IMG = Acc_List[510]
Gray_IMG = cv2.cvtColor(Picking_IMG,cv2.COLOR_RGB2GRAY)
_,Threshold_IMG_TOZERO = cv2.threshold(Gray_IMG,55,255,cv2.THRESH_TOZERO)
Contours,_ = cv2.findContours(Threshold_IMG_TOZERO,cv2.RETR_TREE,cv2.CHAIN_APPROX_SIMPLE)


Copy_Main_IMG = Picking_IMG.copy()
Trans_Empty_Zeros = np.zeros((Copy_Main_IMG.shape[0],Copy_Main_IMG.shape[1]),dtype=np.float32)


for cnt in Contours:

    approx = cv2.approxPolyDP(cnt,0.09*cv2.arcLength(cnt,True),True)

    Drawing_Contour = cv2.drawContours(Gray_IMG,[approx],0,(0,255,0),3)

    n_count = approx.ravel()
    i = 0


    for j in n_count:
        if (i % 2 == 0):
            x = n_count[i]
            y = n_count[i + 1]

            string_coor = str(x) + " " + str(y)

            Marker_IMG = cv2.drawMarker(Copy_Main_IMG,(int(x),int(y)),(0,255,0),thickness=1)
            Trans_Empty_Zeros[int(y),int(x)] = 1

            if (i == 0):
                cv2.putText(Gray_IMG,f"{x},{y}",(x,y),cv2.FONT_HERSHEY_COMPLEX,0.4,(255,0,255))
            else:
                cv2.putText(Gray_IMG,"+",(x,y),cv2.FONT_HERSHEY_COMPLEX,0.4,(0,0,255))

        i = i + 1


axis[0].set_xlabel(Gray_IMG.shape)
axis[0].set_ylabel(Gray_IMG.size)
axis[0].set_title("GRAY")
axis[0].imshow(Gray_IMG,cmap="gray")

axis[1].set_xlabel(Threshold_IMG_TOZERO.shape)
axis[1].set_ylabel(Threshold_IMG_TOZERO.size)
axis[1].set_title("TOZERO")
axis[1].imshow(Threshold_IMG_TOZERO,cmap="hot")

axis[2].set_xlabel(Drawing_Contour.shape)
axis[2].set_ylabel(Drawing_Contour.size)
axis[2].set_title("DRAWING")
axis[2].imshow(Drawing_Contour,cmap="hot")

axis[3].set_xlabel(Marker_IMG.shape)
axis[3].set_ylabel(Marker_IMG.size)
axis[3].set_title("LOC")
axis[3].imshow(Marker_IMG)

axis[4].set_xlabel(Trans_Empty_Zeros.shape)
axis[4].set_ylabel(Trans_Empty_Zeros.size)
axis[4].set_title("TRANSFORMED")
axis[4].imshow(Trans_Empty_Zeros)
<matplotlib.image.AxesImage at 0x7fc40452ca10>
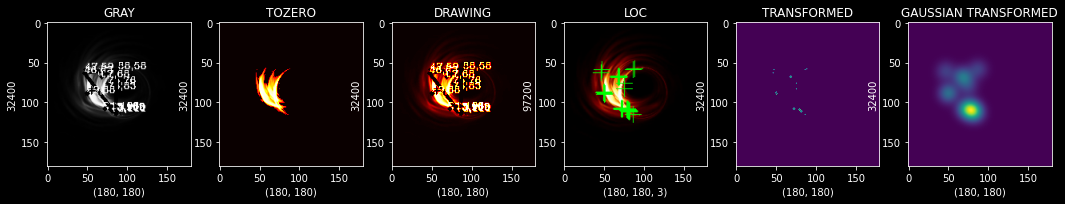
figure,axis = plt.subplots(1,6,figsize=(18,18))

Picking_IMG = Acc_List[55]
Gray_IMG = cv2.cvtColor(Picking_IMG,cv2.COLOR_RGB2GRAY)
_,Threshold_IMG_TOZERO = cv2.threshold(Gray_IMG,90,255,cv2.THRESH_TOZERO)
Contours,_ = cv2.findContours(Threshold_IMG_TOZERO,cv2.RETR_TREE,cv2.CHAIN_APPROX_SIMPLE)


Copy_Main_IMG = Picking_IMG.copy()
Trans_Empty_Zeros = np.zeros((Copy_Main_IMG.shape[0],Copy_Main_IMG.shape[1]),dtype=np.float32)


for cnt in Contours:

    approx = cv2.approxPolyDP(cnt,0.09*cv2.arcLength(cnt,True),True)

    Drawing_Contour = cv2.drawContours(Gray_IMG,[approx],0,(0,255,0),3)

    n_count = approx.ravel()
    i = 0


    for j in n_count:
        if (i % 2 == 0):
            x = n_count[i]
            y = n_count[i + 1]

            string_coor = str(x) + " " + str(y)

            Marker_IMG = cv2.drawMarker(Copy_Main_IMG,(int(x),int(y)),(0,255,0),thickness=1)
            Trans_Empty_Zeros[int(y),int(x)] = 1

            if (i == 0):
                cv2.putText(Gray_IMG,f"{x},{y}",(x,y),cv2.FONT_HERSHEY_COMPLEX,0.4,(255,0,255))
            else:
                cv2.putText(Gray_IMG,"+",(x,y),cv2.FONT_HERSHEY_COMPLEX,0.4,(0,0,255))

        i = i + 1


Gaus_IMG = gaussian_filter(Trans_Empty_Zeros,sigma=8,truncate=6*6)

axis[0].set_xlabel(Gray_IMG.shape)
axis[0].set_ylabel(Gray_IMG.size)
axis[0].set_title("GRAY")
axis[0].imshow(Gray_IMG,cmap="gray")

axis[1].set_xlabel(Threshold_IMG_TOZERO.shape)
axis[1].set_ylabel(Threshold_IMG_TOZERO.size)
axis[1].set_title("TOZERO")
axis[1].imshow(Threshold_IMG_TOZERO,cmap="hot")

axis[2].set_xlabel(Drawing_Contour.shape)
axis[2].set_ylabel(Drawing_Contour.size)
axis[2].set_title("DRAWING")
axis[2].imshow(Drawing_Contour,cmap="hot")

axis[3].set_xlabel(Marker_IMG.shape)
axis[3].set_ylabel(Marker_IMG.size)
axis[3].set_title("LOC")
axis[3].imshow(Marker_IMG)

axis[4].set_xlabel(Trans_Empty_Zeros.shape)
axis[4].set_ylabel(Trans_Empty_Zeros.size)
axis[4].set_title("TRANSFORMED")
axis[4].imshow(Trans_Empty_Zeros)


axis[5].set_xlabel(Gaus_IMG.shape)
axis[5].set_ylabel(Gaus_IMG.size)
axis[5].set_title("GAUSSIAN TRANSFORMED")
axis[5].imshow(Gaus_IMG)
<matplotlib.image.AxesImage at 0x7fc4033c2b50>
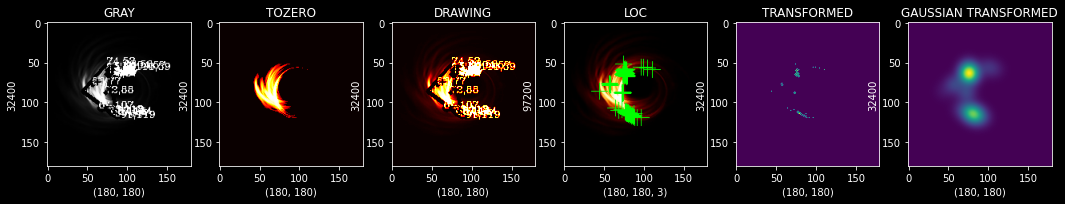
figure,axis = plt.subplots(1,6,figsize=(18,18))

Picking_IMG = Acc_List[100]
Gray_IMG = cv2.cvtColor(Picking_IMG,cv2.COLOR_RGB2GRAY)
_,Threshold_IMG_TOZERO = cv2.threshold(Gray_IMG,55,255,cv2.THRESH_TOZERO)
Contours,_ = cv2.findContours(Threshold_IMG_TOZERO,cv2.RETR_TREE,cv2.CHAIN_APPROX_SIMPLE)


Copy_Main_IMG = Picking_IMG.copy()
Trans_Empty_Zeros = np.zeros((Copy_Main_IMG.shape[0],Copy_Main_IMG.shape[1]),dtype=np.float32)


for cnt in Contours:

    approx = cv2.approxPolyDP(cnt,0.09*cv2.arcLength(cnt,True),True)

    Drawing_Contour = cv2.drawContours(Gray_IMG,[approx],0,(0,255,0),3)

    n_count = approx.ravel()
    i = 0


    for j in n_count:
        if (i % 2 == 0):
            x = n_count[i]
            y = n_count[i + 1]

            string_coor = str(x) + " " + str(y)

            Marker_IMG = cv2.drawMarker(Copy_Main_IMG,(int(x),int(y)),(0,255,0),thickness=1)
            Trans_Empty_Zeros[int(y),int(x)] = 1

            if (i == 0):
                cv2.putText(Gray_IMG,f"{x},{y}",(x,y),cv2.FONT_HERSHEY_COMPLEX,0.4,(255,0,255))
            else:
                cv2.putText(Gray_IMG,"+",(x,y),cv2.FONT_HERSHEY_COMPLEX,0.4,(0,0,255))

        i = i + 1


Gaus_IMG = gaussian_filter(Trans_Empty_Zeros,sigma=8,truncate=4*4)

axis[0].set_xlabel(Gray_IMG.shape)
axis[0].set_ylabel(Gray_IMG.size)
axis[0].set_title("GRAY")
axis[0].imshow(Gray_IMG,cmap="gray")

axis[1].set_xlabel(Threshold_IMG_TOZERO.shape)
axis[1].set_ylabel(Threshold_IMG_TOZERO.size)
axis[1].set_title("TOZERO")
axis[1].imshow(Threshold_IMG_TOZERO,cmap="hot")

axis[2].set_xlabel(Drawing_Contour.shape)
axis[2].set_ylabel(Drawing_Contour.size)
axis[2].set_title("DRAWING")
axis[2].imshow(Drawing_Contour,cmap="hot")

axis[3].set_xlabel(Marker_IMG.shape)
axis[3].set_ylabel(Marker_IMG.size)
axis[3].set_title("LOC")
axis[3].imshow(Marker_IMG)

axis[4].set_xlabel(Trans_Empty_Zeros.shape)
axis[4].set_ylabel(Trans_Empty_Zeros.size)
axis[4].set_title("TRANSFORMED")
axis[4].imshow(Trans_Empty_Zeros)


axis[5].set_xlabel(Gaus_IMG.shape)
axis[5].set_ylabel(Gaus_IMG.size)
axis[5].set_title("GAUSSIAN TRANSFORMED")
axis[5].imshow(Gaus_IMG)
<matplotlib.image.AxesImage at 0x7fc4025179d0>
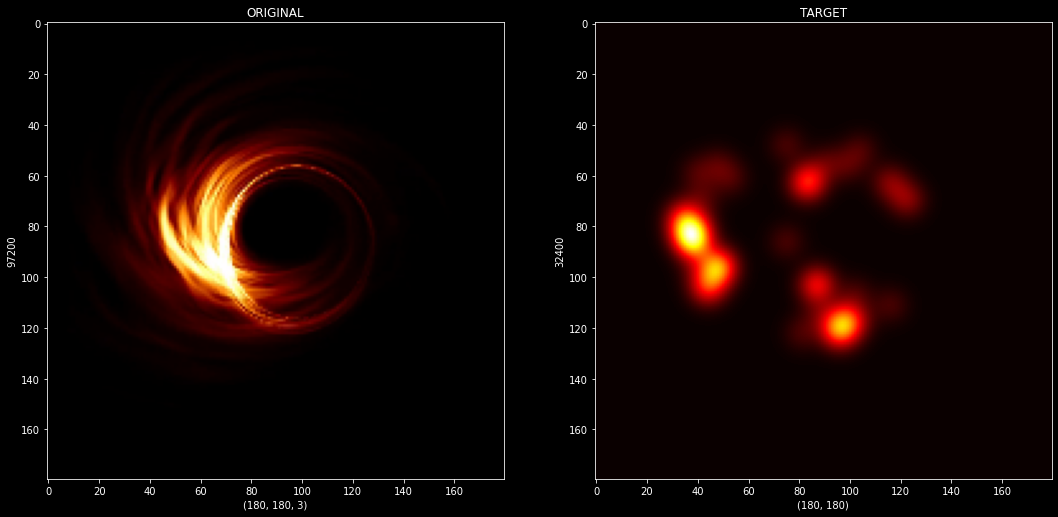
figure,axis = plt.subplots(1,2,figsize=(18,18))

Picking_IMG = Acc_List[100]
Gray_IMG = cv2.cvtColor(Picking_IMG,cv2.COLOR_RGB2GRAY)
_,Threshold_IMG_TOZERO = cv2.threshold(Gray_IMG,20,255,cv2.THRESH_TOZERO)
Contours,_ = cv2.findContours(Threshold_IMG_TOZERO,cv2.RETR_TREE,cv2.CHAIN_APPROX_SIMPLE)


Copy_Main_IMG = Picking_IMG.copy()
Trans_Empty_Zeros = np.zeros((Copy_Main_IMG.shape[0],Copy_Main_IMG.shape[1]),dtype=np.float32)


for cnt in Contours:

    approx = cv2.approxPolyDP(cnt,0.009*cv2.arcLength(cnt,True),True)
    n_count = approx.ravel()
    i = 0


    for j in n_count:
        if (i % 2 == 0):
            x = n_count[i]
            y = n_count[i + 1]

            string_coor = str(x) + " " + str(y)
            Trans_Empty_Zeros[int(y),int(x)] = 1

        i = i + 1


Gaus_IMG = gaussian_filter(Trans_Empty_Zeros,sigma=5,truncate=4*4)

axis[0].set_xlabel(Picking_IMG.shape)
axis[0].set_ylabel(Picking_IMG.size)
axis[0].set_title("ORIGINAL")
axis[0].imshow(Picking_IMG)

axis[1].set_xlabel(Gaus_IMG.shape)
axis[1].set_ylabel(Gaus_IMG.size)
axis[1].set_title("TARGET")
axis[1].imshow(Gaus_IMG,cmap="hot")
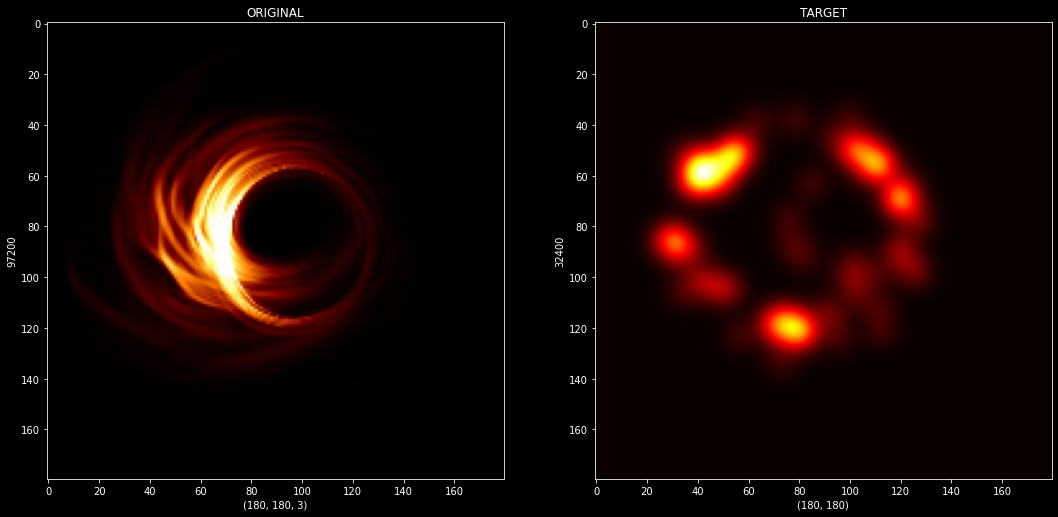
<matplotlib.image.AxesImage at 0x7fc401d88250>
figure,axis = plt.subplots(1,2,figsize=(18,18))

Picking_IMG = Acc_List[500]
Gray_IMG = cv2.cvtColor(Picking_IMG,cv2.COLOR_RGB2GRAY)
_,Threshold_IMG_TOZERO = cv2.threshold(Gray_IMG,10,255,cv2.THRESH_TOZERO)
Contours,_ = cv2.findContours(Threshold_IMG_TOZERO,cv2.RETR_TREE,cv2.CHAIN_APPROX_SIMPLE)


Copy_Main_IMG = Picking_IMG.copy()
Trans_Empty_Zeros = np.zeros((Copy_Main_IMG.shape[0],Copy_Main_IMG.shape[1]),dtype=np.float32)


for cnt in Contours:

    approx = cv2.approxPolyDP(cnt,0.009*cv2.arcLength(cnt,True),True)
    n_count = approx.ravel()
    i = 0


    for j in n_count:
        if (i % 2 == 0):
            x = n_count[i]
            y = n_count[i + 1]

            string_coor = str(x) + " " + str(y)
            Trans_Empty_Zeros[int(y),int(x)] = 1

        i = i + 1


Gaus_IMG = gaussian_filter(Trans_Empty_Zeros,sigma=5,truncate=4*4)

axis[0].set_xlabel(Picking_IMG.shape)
axis[0].set_ylabel(Picking_IMG.size)
axis[0].set_title("ORIGINAL")
axis[0].imshow(Picking_IMG)

axis[1].set_xlabel(Gaus_IMG.shape)
axis[1].set_ylabel(Gaus_IMG.size)
axis[1].set_title("TARGET")
axis[1].imshow(Gaus_IMG,cmap="hot")
<matplotlib.image.AxesImage at 0x7fc401a70850>
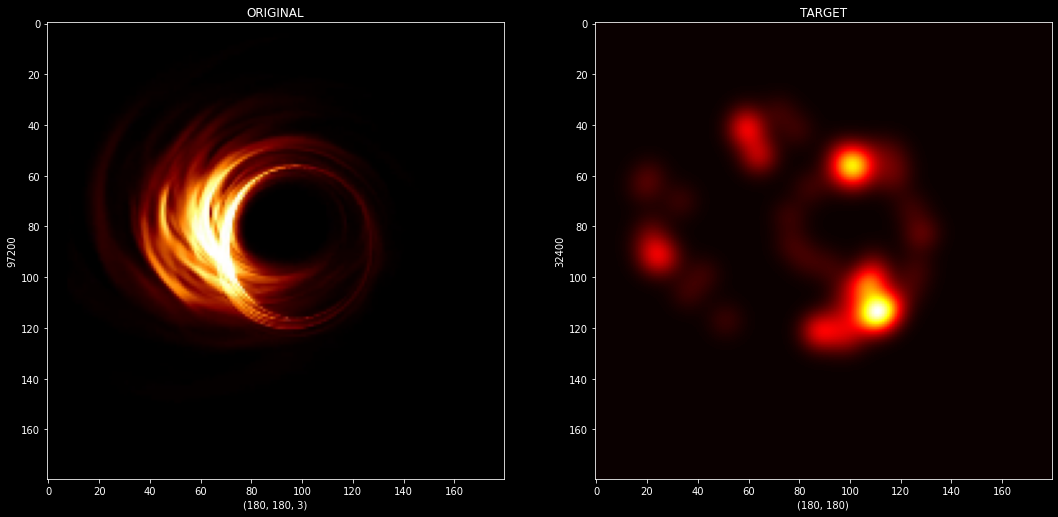
figure,axis = plt.subplots(1,2,figsize=(18,18))

Picking_IMG = Acc_List[387]
Gray_IMG = cv2.cvtColor(Picking_IMG,cv2.COLOR_RGB2GRAY)
_,Threshold_IMG_TOZERO = cv2.threshold(Gray_IMG,10,255,cv2.THRESH_TOZERO)
Contours,_ = cv2.findContours(Threshold_IMG_TOZERO,cv2.RETR_TREE,cv2.CHAIN_APPROX_SIMPLE)


Copy_Main_IMG = Picking_IMG.copy()
Trans_Empty_Zeros = np.zeros((Copy_Main_IMG.shape[0],Copy_Main_IMG.shape[1]),dtype=np.float32)


for cnt in Contours:

    approx = cv2.approxPolyDP(cnt,0.009*cv2.arcLength(cnt,True),True)
    n_count = approx.ravel()
    i = 0


    for j in n_count:
        if (i % 2 == 0):
            x = n_count[i]
            y = n_count[i + 1]

            string_coor = str(x) + " " + str(y)
            Trans_Empty_Zeros[int(y),int(x)] = 1

        i = i + 1


Gaus_IMG = gaussian_filter(Trans_Empty_Zeros,sigma=5,truncate=4*4)

axis[0].set_xlabel(Picking_IMG.shape)
axis[0].set_ylabel(Picking_IMG.size)
axis[0].set_title("ORIGINAL")
axis[0].imshow(Picking_IMG)

axis[1].set_xlabel(Gaus_IMG.shape)
axis[1].set_ylabel(Gaus_IMG.size)
axis[1].set_title("TARGET")
axis[1].imshow(Gaus_IMG,cmap="hot")
<matplotlib.image.AxesImage at 0x7fc401914790>
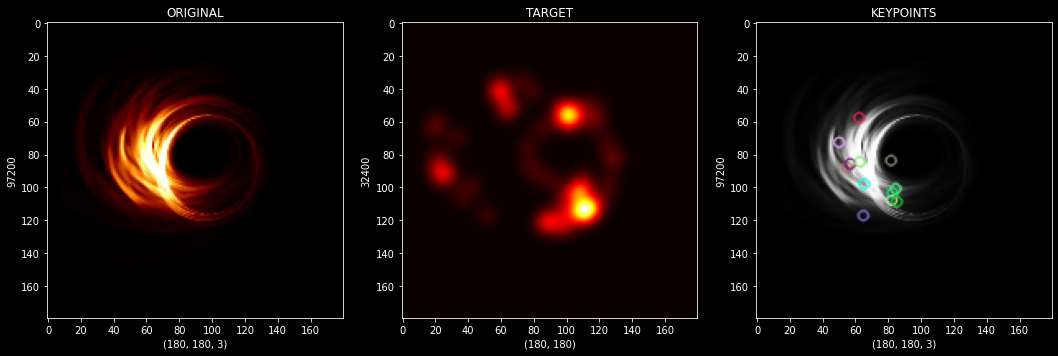
Keypoints with Coordinates
figure,axis = plt.subplots(1,3,figsize=(18,18))

Picking_IMG = Acc_List[387]
Gray_IMG = cv2.cvtColor(Picking_IMG,cv2.COLOR_RGB2GRAY)
_,Threshold_IMG_TOZERO = cv2.threshold(Gray_IMG,10,255,cv2.THRESH_TOZERO)
Contours,_ = cv2.findContours(Threshold_IMG_TOZERO,cv2.RETR_TREE,cv2.CHAIN_APPROX_SIMPLE)


Copy_Main_IMG = Picking_IMG.copy()
Trans_Empty_Zeros = np.zeros((Copy_Main_IMG.shape[0],Copy_Main_IMG.shape[1]),dtype=np.float32)

for cnt in Contours:

    approx = cv2.approxPolyDP(cnt,0.009*cv2.arcLength(cnt,True),True)
    n_count = approx.ravel()
    i = 0


    for j in n_count:
        if (i % 2 == 0):
            x = n_count[i]
            y = n_count[i + 1]

            string_coor = str(x) + " " + str(y)
            Trans_Empty_Zeros[int(y),int(x)] = 1

        i = i + 1


Gaus_IMG = gaussian_filter(Trans_Empty_Zeros,sigma=5,truncate=4*4)

Sift_Function = cv2.SIFT_create()
keypoints,desc = Sift_Function.detectAndCompute(Threshold_IMG_TOZERO,None)
Key_IMG = cv2.drawKeypoints(Gray_IMG,keypoints,Gray_IMG)

axis[0].set_xlabel(Picking_IMG.shape)
axis[0].set_ylabel(Picking_IMG.size)
axis[0].set_title("ORIGINAL")
axis[0].imshow(Picking_IMG)

axis[1].set_xlabel(Gaus_IMG.shape)
axis[1].set_ylabel(Gaus_IMG.size)
axis[1].set_title("TARGET")
axis[1].imshow(Gaus_IMG,cmap="hot")

axis[2].set_xlabel(Key_IMG.shape)
axis[2].set_ylabel(Key_IMG.size)
axis[2].set_title("KEYPOINTS")
axis[2].imshow(Key_IMG)
<matplotlib.image.AxesImage at 0x7fc400ee42d0>
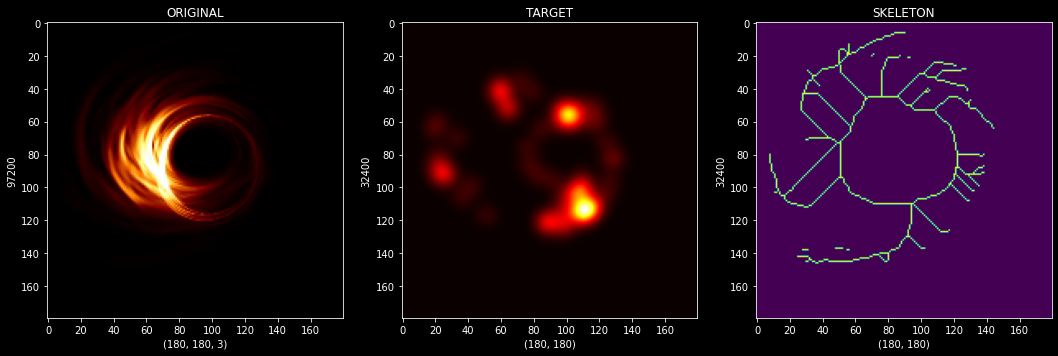
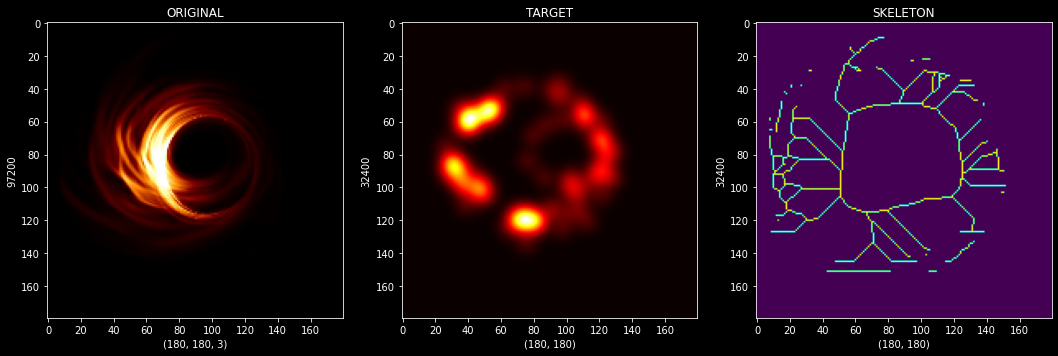
Skeleton with Target
figure,axis = plt.subplots(1,3,figsize=(18,18))

Picking_IMG = Acc_List[387]
Gray_IMG = cv2.cvtColor(Picking_IMG,cv2.COLOR_RGB2GRAY)
_,Threshold_IMG_TOZERO = cv2.threshold(Gray_IMG,10,255,cv2.THRESH_TOZERO)
Contours,_ = cv2.findContours(Threshold_IMG_TOZERO,cv2.RETR_TREE,cv2.CHAIN_APPROX_SIMPLE)


Copy_Main_IMG = Picking_IMG.copy()
Trans_Empty_Zeros = np.zeros((Copy_Main_IMG.shape[0],Copy_Main_IMG.shape[1]),dtype=np.float32)

for cnt in Contours:

    approx = cv2.approxPolyDP(cnt,0.009*cv2.arcLength(cnt,True),True)
    n_count = approx.ravel()
    i = 0


    for j in n_count:
        if (i % 2 == 0):
            x = n_count[i]
            y = n_count[i + 1]

            string_coor = str(x) + " " + str(y)
            Trans_Empty_Zeros[int(y),int(x)] = 1

        i = i + 1


Gaus_IMG = gaussian_filter(Trans_Empty_Zeros,sigma=5,truncate=4*4)
Array_Target = np.array(Gray_IMG > Gaus_IMG).astype(int)
Skeleton_IMG = skimage.morphology.skeletonize(Array_Target)

axis[0].set_xlabel(Picking_IMG.shape)
axis[0].set_ylabel(Picking_IMG.size)
axis[0].set_title("ORIGINAL")
axis[0].imshow(Picking_IMG)

axis[1].set_xlabel(Gaus_IMG.shape)
axis[1].set_ylabel(Gaus_IMG.size)
axis[1].set_title("TARGET")
axis[1].imshow(Gaus_IMG,cmap="hot")

axis[2].set_xlabel(Skeleton_IMG.shape)
axis[2].set_ylabel(Skeleton_IMG.size)
axis[2].set_title("SKELETON")
axis[2].imshow(Skeleton_IMG)
<matplotlib.image.AxesImage at 0x7fc4002bd2d0>
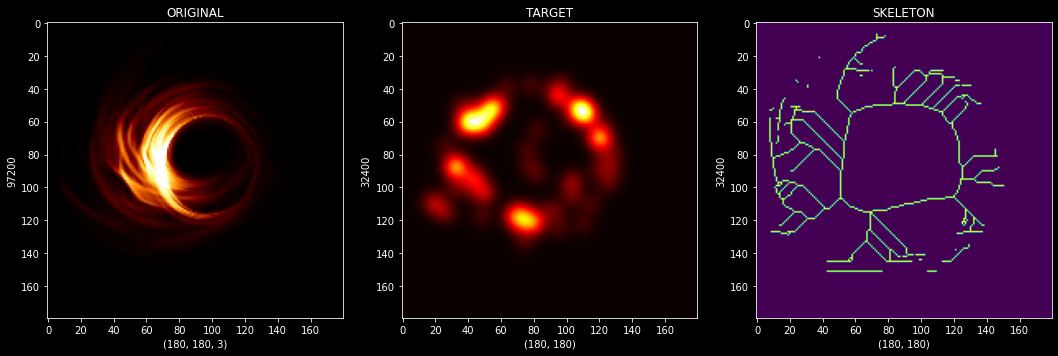
figure,axis = plt.subplots(1,3,figsize=(18,18))

Picking_IMG = Acc_List[501]
Gray_IMG = cv2.cvtColor(Picking_IMG,cv2.COLOR_RGB2GRAY)
_,Threshold_IMG_TOZERO = cv2.threshold(Gray_IMG,10,255,cv2.THRESH_TOZERO)
Contours,_ = cv2.findContours(Threshold_IMG_TOZERO,cv2.RETR_TREE,cv2.CHAIN_APPROX_SIMPLE)


Copy_Main_IMG = Picking_IMG.copy()
Trans_Empty_Zeros = np.zeros((Copy_Main_IMG.shape[0],Copy_Main_IMG.shape[1]),dtype=np.float32)

for cnt in Contours:

    approx = cv2.approxPolyDP(cnt,0.009*cv2.arcLength(cnt,True),True)
    n_count = approx.ravel()
    i = 0


    for j in n_count:
        if (i % 2 == 0):
            x = n_count[i]
            y = n_count[i + 1]

            string_coor = str(x) + " " + str(y)
            Trans_Empty_Zeros[int(y),int(x)] = 1

        i = i + 1


Gaus_IMG = gaussian_filter(Trans_Empty_Zeros,sigma=5,truncate=4*4)
Array_Target = np.array(Gray_IMG > Gaus_IMG).astype(int)
Skeleton_IMG = skimage.morphology.skeletonize(Array_Target)

axis[0].set_xlabel(Picking_IMG.shape)
axis[0].set_ylabel(Picking_IMG.size)
axis[0].set_title("ORIGINAL")
axis[0].imshow(Picking_IMG)

axis[1].set_xlabel(Gaus_IMG.shape)
axis[1].set_ylabel(Gaus_IMG.size)
axis[1].set_title("TARGET")
axis[1].imshow(Gaus_IMG,cmap="hot")

axis[2].set_xlabel(Skeleton_IMG.shape)
axis[2].set_ylabel(Skeleton_IMG.size)
axis[2].set_title("SKELETON")
axis[2].imshow(Skeleton_IMG)
<matplotlib.image.AxesImage at 0x7fc40015b210>
figure,axis = plt.subplots(1,3,figsize=(18,18))

Picking_IMG = Acc_List[499]
Gray_IMG = cv2.cvtColor(Picking_IMG,cv2.COLOR_RGB2GRAY)
_,Threshold_IMG_TOZERO = cv2.threshold(Gray_IMG,10,255,cv2.THRESH_TOZERO)
Contours,_ = cv2.findContours(Threshold_IMG_TOZERO,cv2.RETR_TREE,cv2.CHAIN_APPROX_SIMPLE)


Copy_Main_IMG = Picking_IMG.copy()
Trans_Empty_Zeros = np.zeros((Copy_Main_IMG.shape[0],Copy_Main_IMG.shape[1]),dtype=np.float32)

for cnt in Contours:

    approx = cv2.approxPolyDP(cnt,0.009*cv2.arcLength(cnt,True),True)
    n_count = approx.ravel()
    i = 0


    for j in n_count:
        if (i % 2 == 0):
            x = n_count[i]
            y = n_count[i + 1]

            string_coor = str(x) + " " + str(y)
            Trans_Empty_Zeros[int(y),int(x)] = 1

        i = i + 1


Gaus_IMG = gaussian_filter(Trans_Empty_Zeros,sigma=5,truncate=4*4)
Array_Target = np.array(Gray_IMG > Gaus_IMG).astype(int)
Skeleton_IMG = skimage.morphology.skeletonize(Array_Target)

axis[0].set_xlabel(Picking_IMG.shape)
axis[0].set_ylabel(Picking_IMG.size)
axis[0].set_title("ORIGINAL")
axis[0].imshow(Picking_IMG)

axis[1].set_xlabel(Gaus_IMG.shape)
axis[1].set_ylabel(Gaus_IMG.size)
axis[1].set_title("TARGET")
axis[1].imshow(Gaus_IMG,cmap="hot")

axis[2].set_xlabel(Skeleton_IMG.shape)
axis[2].set_ylabel(Skeleton_IMG.size)
axis[2].set_title("SKELETON")
axis[2].imshow(Skeleton_IMG)
<matplotlib.image.AxesImage at 0x7fc3fff956d0>
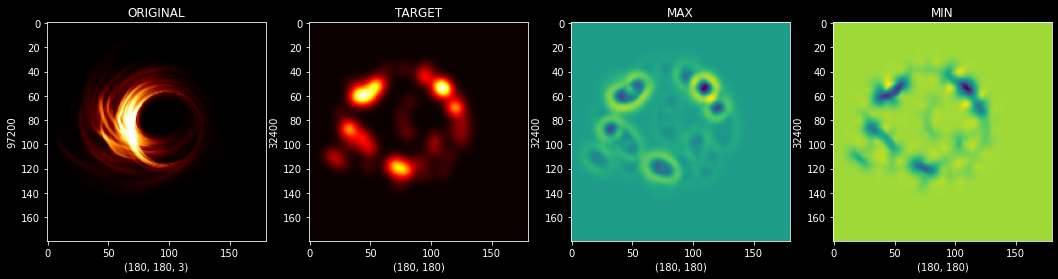
Hessian Spectrum with Target
figure,axis = plt.subplots(1,4,figsize=(18,18))

Picking_IMG = Acc_List[499]
Gray_IMG = cv2.cvtColor(Picking_IMG,cv2.COLOR_RGB2GRAY)
_,Threshold_IMG_TOZERO = cv2.threshold(Gray_IMG,10,255,cv2.THRESH_TOZERO)
Contours,_ = cv2.findContours(Threshold_IMG_TOZERO,cv2.RETR_TREE,cv2.CHAIN_APPROX_SIMPLE)


Copy_Main_IMG = Picking_IMG.copy()
Trans_Empty_Zeros = np.zeros((Copy_Main_IMG.shape[0],Copy_Main_IMG.shape[1]),dtype=np.float32)

for cnt in Contours:

    approx = cv2.approxPolyDP(cnt,0.009*cv2.arcLength(cnt,True),True)
    n_count = approx.ravel()
    i = 0


    for j in n_count:
        if (i % 2 == 0):
            x = n_count[i]
            y = n_count[i + 1]

            string_coor = str(x) + " " + str(y)
            Trans_Empty_Zeros[int(y),int(x)] = 1

        i = i + 1


Gaus_IMG = gaussian_filter(Trans_Empty_Zeros,sigma=5,truncate=4*4)

Hessian_IMG = hessian_matrix(Gaus_IMG,sigma=0.5,order="rc")
max_IMG,min_IMG = hessian_matrix_eigvals(Hessian_IMG)

axis[0].set_xlabel(Picking_IMG.shape)
axis[0].set_ylabel(Picking_IMG.size)
axis[0].set_title("ORIGINAL")
axis[0].imshow(Picking_IMG)

axis[1].set_xlabel(Gaus_IMG.shape)
axis[1].set_ylabel(Gaus_IMG.size)
axis[1].set_title("TARGET")
axis[1].imshow(Gaus_IMG,cmap="hot")

axis[2].set_xlabel(max_IMG.shape)
axis[2].set_ylabel(max_IMG.size)
axis[2].set_title("MAX")
axis[2].imshow(max_IMG)

axis[3].set_xlabel(min_IMG.shape)
axis[3].set_ylabel(min_IMG.size)
axis[3].set_title("MIN")
axis[3].imshow(min_IMG)
<matplotlib.image.AxesImage at 0x7fc3ffcdbe50>
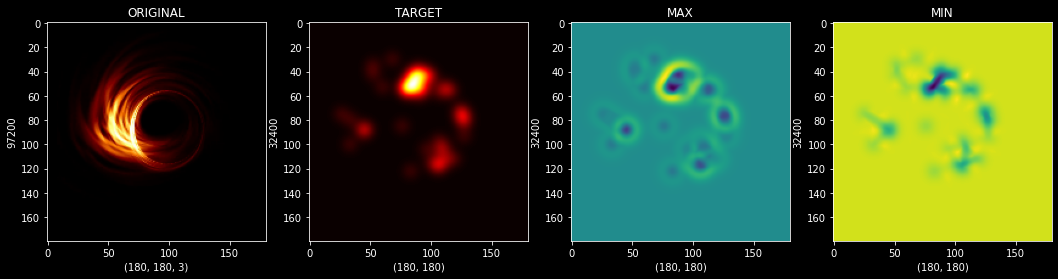
figure,axis = plt.subplots(1,4,figsize=(18,18))

Picking_IMG = Acc_List[34]
Gray_IMG = cv2.cvtColor(Picking_IMG,cv2.COLOR_RGB2GRAY)
_,Threshold_IMG_TOZERO = cv2.threshold(Gray_IMG,10,255,cv2.THRESH_TOZERO)
Contours,_ = cv2.findContours(Threshold_IMG_TOZERO,cv2.RETR_TREE,cv2.CHAIN_APPROX_SIMPLE)


Copy_Main_IMG = Picking_IMG.copy()
Trans_Empty_Zeros = np.zeros((Copy_Main_IMG.shape[0],Copy_Main_IMG.shape[1]),dtype=np.float32)

for cnt in Contours:

    approx = cv2.approxPolyDP(cnt,0.009*cv2.arcLength(cnt,True),True)
    n_count = approx.ravel()
    i = 0


    for j in n_count:
        if (i % 2 == 0):
            x = n_count[i]
            y = n_count[i + 1]

            string_coor = str(x) + " " + str(y)
            Trans_Empty_Zeros[int(y),int(x)] = 1

        i = i + 1


Gaus_IMG = gaussian_filter(Trans_Empty_Zeros,sigma=5,truncate=4*4)

Hessian_IMG = hessian_matrix(Gaus_IMG,sigma=0.5,order="rc")
max_IMG,min_IMG = hessian_matrix_eigvals(Hessian_IMG)

axis[0].set_xlabel(Picking_IMG.shape)
axis[0].set_ylabel(Picking_IMG.size)
axis[0].set_title("ORIGINAL")
axis[0].imshow(Picking_IMG)

axis[1].set_xlabel(Gaus_IMG.shape)
axis[1].set_ylabel(Gaus_IMG.size)
axis[1].set_title("TARGET")
axis[1].imshow(Gaus_IMG,cmap="hot")

axis[2].set_xlabel(max_IMG.shape)
axis[2].set_ylabel(max_IMG.size)
axis[2].set_title("MAX")
axis[2].imshow(max_IMG)

axis[3].set_xlabel(min_IMG.shape)
axis[3].set_ylabel(min_IMG.size)
axis[3].set_title("MIN")
axis[3].imshow(min_IMG)
<matplotlib.image.AxesImage at 0x7fc3ffad2e10>
Data Processing
Transformation
Original_List = []
Target_List = []

for image_x in Acc_List:

    Picking_IMG = image_x
    Gray_IMG = cv2.cvtColor(Picking_IMG,cv2.COLOR_RGB2GRAY)
    _,Threshold_IMG_TOZERO = cv2.threshold(Gray_IMG,10,255,cv2.THRESH_TOZERO)
    Contours,_ = cv2.findContours(Threshold_IMG_TOZERO,cv2.RETR_TREE,cv2.CHAIN_APPROX_SIMPLE)


    Copy_Main_IMG = Picking_IMG.copy()
    Trans_Empty_Zeros = np.zeros((Copy_Main_IMG.shape[0],Copy_Main_IMG.shape[1]),dtype=np.float32)

    for cnt in Contours:

        approx = cv2.approxPolyDP(cnt,0.009*cv2.arcLength(cnt,True),True)
        n_count = approx.ravel()
        i = 0


        for j in n_count:
            if (i % 2 == 0):
                x = n_count[i]
                y = n_count[i + 1]

                string_coor = str(x) + " " + str(y)
                Trans_Empty_Zeros[int(y),int(x)] = 1

            i = i + 1


    Gaus_IMG = gaussian_filter(Trans_Empty_Zeros,sigma=5,truncate=4*4)

    Original_List.append(Picking_IMG)
    Target_List.append(Gaus_IMG)
print("WHEN IT IS ARRAY ORIGINAL SHAPE: ",np.shape(np.array(Original_List)))
print("WHEN IT IS ARRAY TARGET SHAPE: ",np.shape(np.array(Target_List)))
WHEN IT IS ARRAY ORIGINAL SHAPE:  (513, 180, 180, 3)
WHEN IT IS ARRAY TARGET SHAPE:  (513, 180, 180)
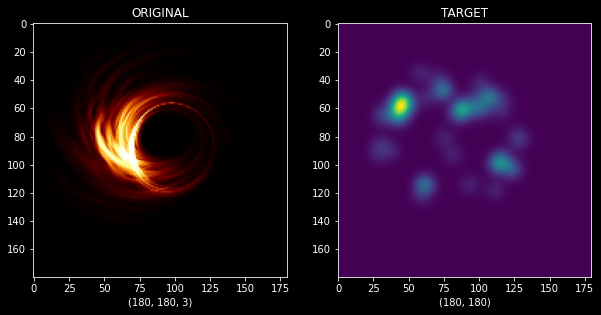
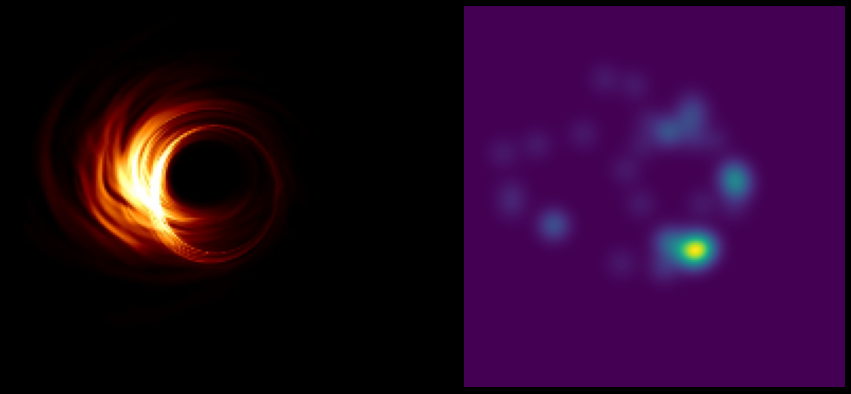
figure,axis = plt.subplots(1,2,figsize=(10,10))

axis[0].imshow(Original_List[100])
axis[0].set_xlabel(Original_List[100].shape)
axis[0].set_title("ORIGINAL")
axis[1].imshow(Target_List[100])
axis[1].set_xlabel(Target_List[100].shape)
axis[1].set_title("TARGET")
Text(0.5, 1.0, 'TARGET')
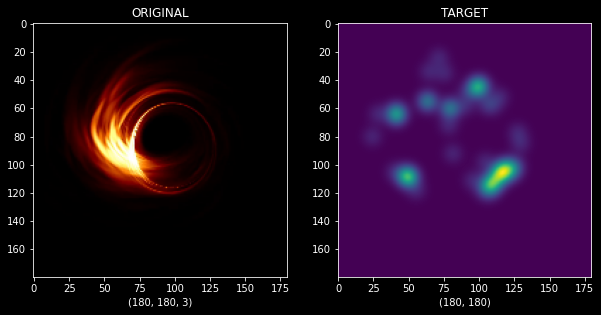
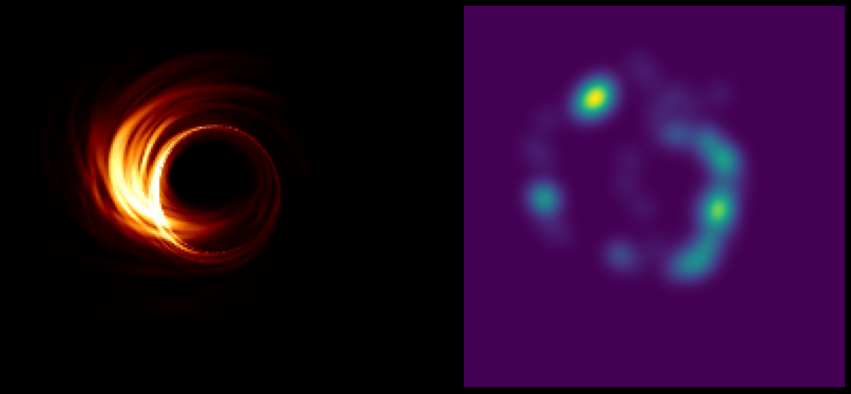
figure,axis = plt.subplots(1,2,figsize=(10,10))

axis[0].imshow(Original_List[1])
axis[0].set_xlabel(Original_List[1].shape)
axis[0].set_title("ORIGINAL")
axis[1].imshow(Target_List[1])
axis[1].set_xlabel(Target_List[1].shape)
axis[1].set_title("TARGET")
Text(0.5, 1.0, 'TARGET')
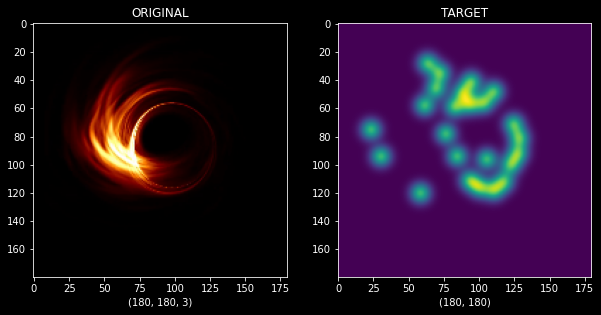
figure,axis = plt.subplots(1,2,figsize=(10,10))

axis[0].imshow(Original_List[10])
axis[0].set_xlabel(Original_List[10].shape)
axis[0].set_title("ORIGINAL")
axis[1].imshow(Target_List[10])
axis[1].set_xlabel(Target_List[10].shape)
axis[1].set_title("TARGET")
Text(0.5, 1.0, 'TARGET')
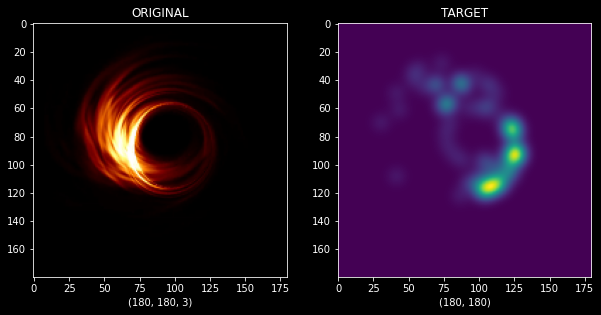
figure,axis = plt.subplots(1,2,figsize=(10,10))

axis[0].imshow(Original_List[300])
axis[0].set_xlabel(Original_List[300].shape)
axis[0].set_title("ORIGINAL")
axis[1].imshow(Target_List[300])
axis[1].set_xlabel(Target_List[300].shape)
axis[1].set_title("TARGET")
Text(0.5, 1.0, 'TARGET')
figure,axis = plt.subplots(1,2,figsize=(15,15))

Count_IMG = 300

axis[0].imshow(Original_List[Count_IMG])
axis[0].axis("off")
axis[1].imshow(Target_List[Count_IMG])
axis[1].axis("off")

plt.savefig(f"IMG{Count_IMG}.png")
figure,axis = plt.subplots(1,2,figsize=(15,15))

Count_IMG = 30

axis[0].imshow(Original_List[Count_IMG])
axis[0].axis("off")
axis[1].imshow(Target_List[Count_IMG])
axis[1].axis("off")

plt.savefig(f"IMG{Count_IMG}.png")
figure,axis = plt.subplots(1,2,figsize=(15,15))

Count_IMG = 3

axis[0].imshow(Original_List[Count_IMG])
axis[0].axis("off")
axis[1].imshow(Target_List[Count_IMG])
axis[1].axis("off")

plt.savefig(f"IMG{Count_IMG}.png")
figure,axis = plt.subplots(1,2,figsize=(15,15))

Count_IMG = 450

axis[0].imshow(Original_List[Count_IMG])
axis[0].axis("off")
axis[1].imshow(Target_List[Count_IMG])
axis[1].axis("off")

plt.savefig(f"IMG{Count_IMG}.png")
figure,axis = plt.subplots(1,2,figsize=(15,15))

Count_IMG = 500

axis[0].imshow(Original_List[Count_IMG])
axis[0].axis("off")
axis[1].imshow(Target_List[Count_IMG])
axis[1].axis("off")

plt.savefig(f"IMG{Count_IMG}.png")
figure,axis = plt.subplots(1,2,figsize=(15,15))

Count_IMG = 22

axis[0].imshow(Original_List[Count_IMG])
axis[0].axis("off")
axis[1].imshow(Target_List[Count_IMG])
axis[1].axis("off")

plt.savefig(f"IMG{Count_IMG}.png")
figure,axis = plt.subplots(1,2,figsize=(15,15))

Count_IMG = 2

axis[0].imshow(Original_List[Count_IMG])
axis[0].axis("off")
axis[1].imshow(Target_List[Count_IMG])
axis[1].axis("off")

plt.savefig(f"IMG{Count_IMG}.png")
figure,axis = plt.subplots(1,2,figsize=(15,15))

Count_IMG = 444

axis[0].imshow(Original_List[Count_IMG])
axis[0].axis("off")
axis[1].imshow(Target_List[Count_IMG])
axis[1].axis("off")

plt.savefig(f"IMG{Count_IMG}.png")
figure,axis = plt.subplots(1,2,figsize=(15,15))

Count_IMG = 401

axis[0].imshow(Original_List[Count_IMG])
axis[0].axis("off")
axis[1].imshow(Target_List[Count_IMG])
axis[1].axis("off")

plt.savefig(f"IMG{Count_IMG}.png")
figure,axis = plt.subplots(1,2,figsize=(15,15))

Count_IMG = 230

axis[0].imshow(Original_List[Count_IMG])
axis[0].axis("off")
axis[1].imshow(Target_List[Count_IMG])
axis[1].axis("off")

plt.savefig(f"IMG{Count_IMG}.png")
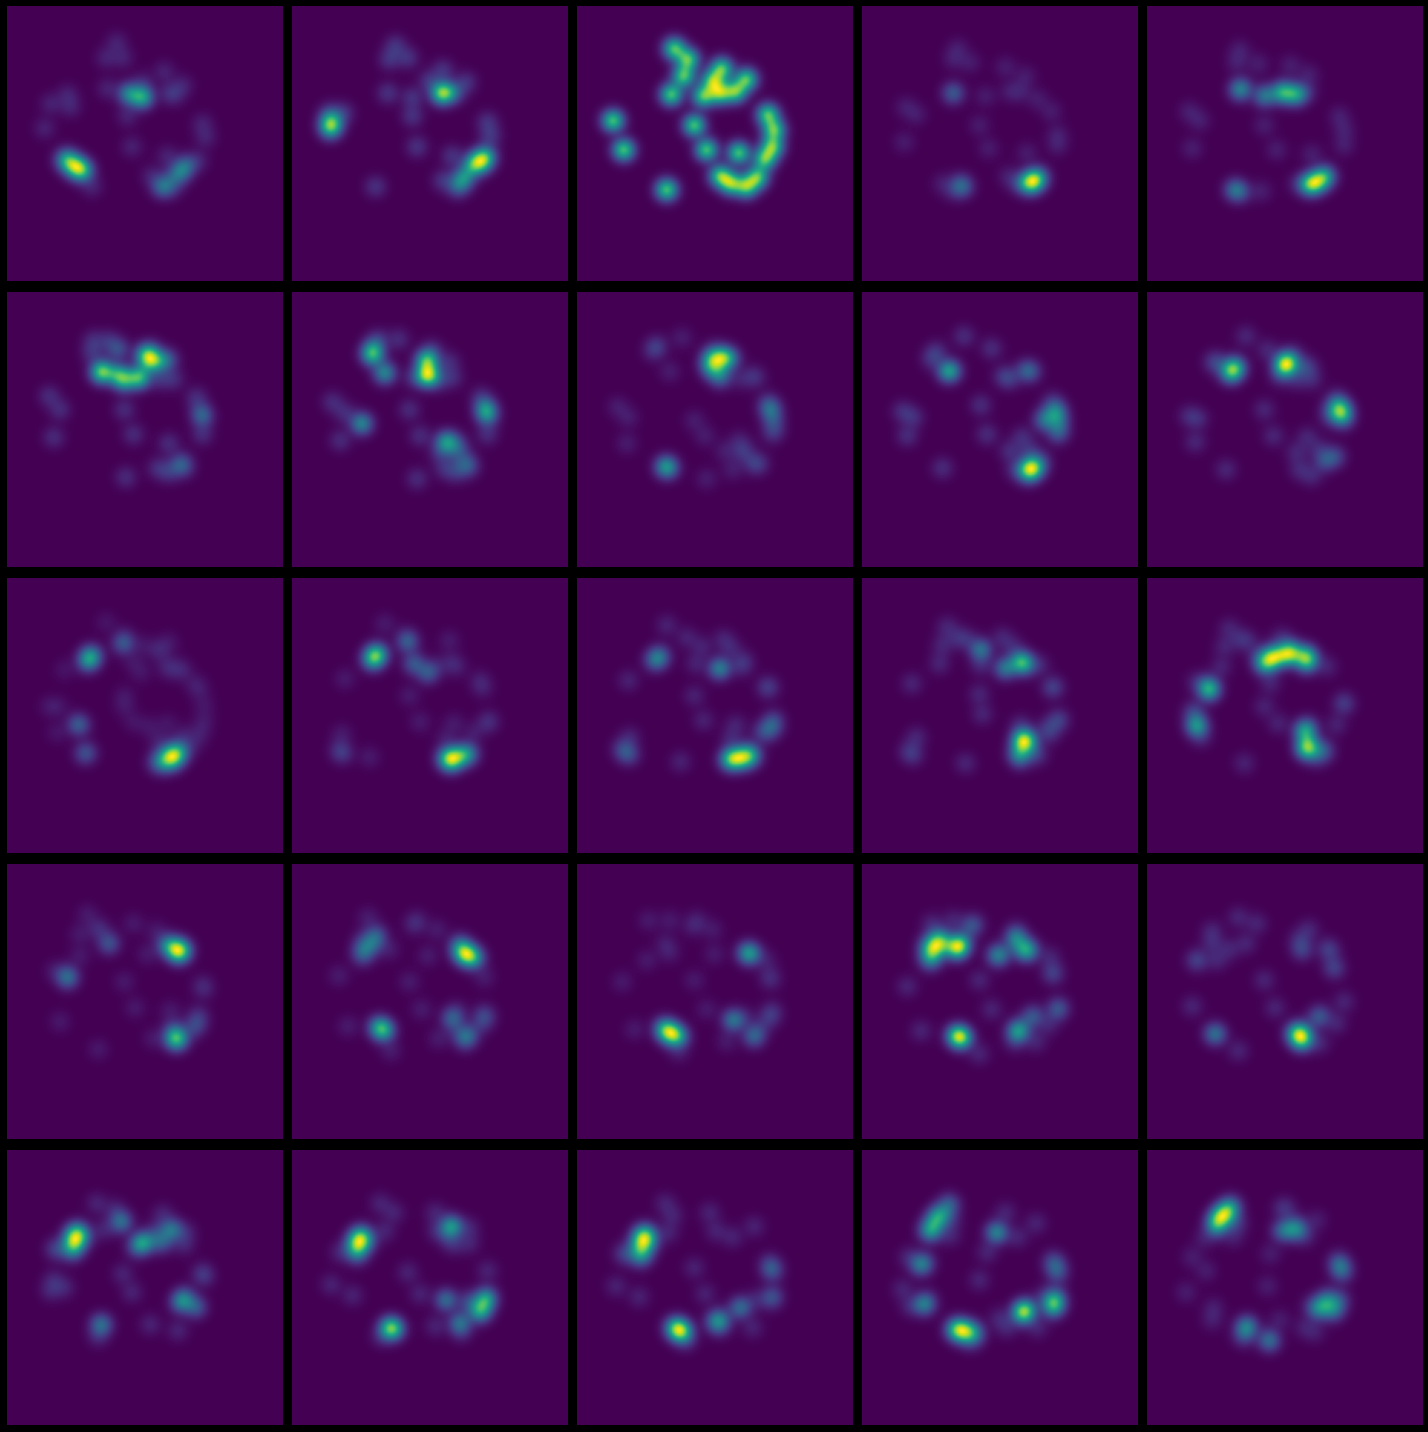
figure,axis = plt.subplots(5,5,figsize=(20,20))

for indexing,operations in enumerate(axis.flat):

    Picking_IMG = Target_List[indexing*5]

    operations.imshow(Picking_IMG)
    operations.axis("off")
    plt.savefig(f"IMG_TOTAL{indexing}.png")

plt.tight_layout()
plt.show()
Transforming data into array
Train_Set = np.array(Original_List,dtype="float32")
Transformation_Set = np.array(Target_List,dtype="float32")

Train_Set = Train_Set / 255.
Transformation_Set = Transformation_Set / 255.
print(Train_Set.shape)
print(Transformation_Set.shape)
(513, 180, 180, 3)
(513, 180, 180)
Modelling
Checkpoint_Model = tf.keras.callbacks.ModelCheckpoint(monitor="val_accuracy",
                                                      save_best_only=True,
                                                      save_weights_only=True,
                                                      filepath="./modelcheck")
Reduce_Model = tf.keras.callbacks.ReduceLROnPlateau(monitor="val_accuracy",
                                                   factor=0.02,
                                                    min_delta=0.0001,
                                                   patience=5)

compile_loss = "binary_crossentropy"
compile_optimizer = Adam(lr=0.0000001)
output_class = 1
Encoder_G = Sequential()
Encoder_G.add(Conv2D(32,(7,7),kernel_initializer = 'he_normal',use_bias=True))
Encoder_G.add(BatchNormalization())
Encoder_G.add(ReLU())

Encoder_G.add(Conv2D(64,(7,7),kernel_initializer = 'he_normal',use_bias=True))
Encoder_G.add(BatchNormalization())
Encoder_G.add(ReLU())

Encoder_G.add(Conv2D(128,(2,2),kernel_initializer = 'he_normal',use_bias=True))
Encoder_G.add(BatchNormalization())
Encoder_G.add(ReLU())


Decoder_G = Sequential()
Decoder_G.add(Conv2DTranspose(64,(7,7)))
Decoder_G.add(ReLU())

Decoder_G.add(Conv2DTranspose(32,(7,7)))
Decoder_G.add(ReLU())

Decoder_G.add(Conv2DTranspose(output_class,(2,2)))
Auto_Encoder = Sequential([Encoder_G,Decoder_G])
Auto_Encoder.compile(loss=compile_loss,optimizer=compile_optimizer,metrics=["mse"])
Model_AutoEncoder = Auto_Encoder.fit(Train_Set,Transformation_Set,epochs=25,callbacks=[Checkpoint_Model,Reduce_Model])
Epoch 1/25
17/17 [==============================] - 12s 342ms/step - loss: 0.0024 - mse: 0.3743
Epoch 2/25
17/17 [==============================] - 6s 330ms/step - loss: 0.0021 - mse: 0.3862
Epoch 3/25
17/17 [==============================] - 6s 329ms/step - loss: 0.0019 - mse: 0.3972
Epoch 4/25
17/17 [==============================] - 6s 329ms/step - loss: 0.0018 - mse: 0.4093
Epoch 5/25
17/17 [==============================] - 6s 329ms/step - loss: 0.0016 - mse: 0.4199
Epoch 6/25
17/17 [==============================] - 6s 332ms/step - loss: 0.0015 - mse: 0.4305
Epoch 7/25
17/17 [==============================] - 6s 330ms/step - loss: 0.0013 - mse: 0.4407
Epoch 8/25
17/17 [==============================] - 6s 330ms/step - loss: 0.0012 - mse: 0.4501
Epoch 9/25
17/17 [==============================] - 6s 330ms/step - loss: 0.0011 - mse: 0.4593
Epoch 10/25
17/17 [==============================] - 6s 329ms/step - loss: 0.0011 - mse: 0.4695
Epoch 11/25
17/17 [==============================] - 6s 329ms/step - loss: 9.6168e-04 - mse: 0.4771
Epoch 12/25
17/17 [==============================] - 6s 330ms/step - loss: 9.1044e-04 - mse: 0.4861
Epoch 13/25
17/17 [==============================] - 6s 332ms/step - loss: 8.4804e-04 - mse: 0.4939
Epoch 14/25
17/17 [==============================] - 6s 329ms/step - loss: 7.9199e-04 - mse: 0.5029
Epoch 15/25
17/17 [==============================] - 6s 329ms/step - loss: 7.4422e-04 - mse: 0.5098
Epoch 16/25
17/17 [==============================] - 6s 330ms/step - loss: 6.9968e-04 - mse: 0.5180
Epoch 17/25
17/17 [==============================] - 6s 330ms/step - loss: 6.4096e-04 - mse: 0.5250
Epoch 18/25
17/17 [==============================] - 6s 329ms/step - loss: 5.9892e-04 - mse: 0.5329
Epoch 19/25
17/17 [==============================] - 6s 331ms/step - loss: 5.7138e-04 - mse: 0.5382
Epoch 20/25
17/17 [==============================] - 6s 329ms/step - loss: 5.4640e-04 - mse: 0.5457
Epoch 21/25
17/17 [==============================] - 6s 330ms/step - loss: 5.1593e-04 - mse: 0.5530
Epoch 22/25
17/17 [==============================] - 6s 329ms/step - loss: 4.8948e-04 - mse: 0.5596
Epoch 23/25
17/17 [==============================] - 6s 330ms/step - loss: 4.7569e-04 - mse: 0.5655
Epoch 24/25
17/17 [==============================] - 6s 329ms/step - loss: 4.4940e-04 - mse: 0.5715
Epoch 25/25
17/17 [==============================] - 6s 331ms/step - loss: 4.3678e-04 - mse: 0.5774
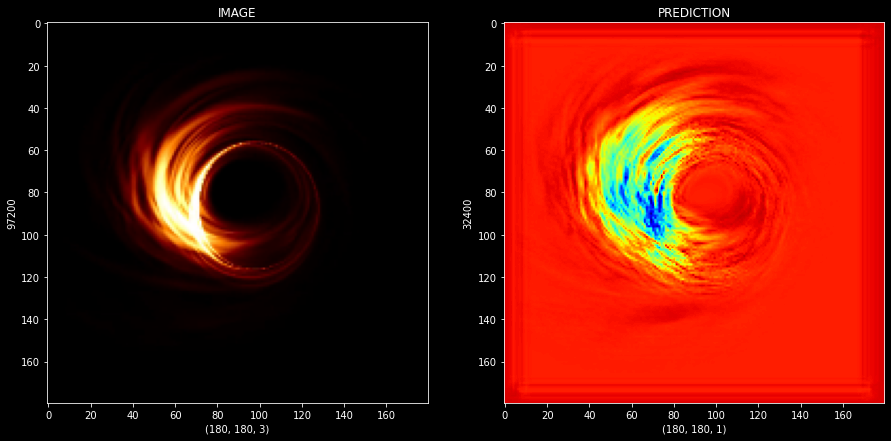
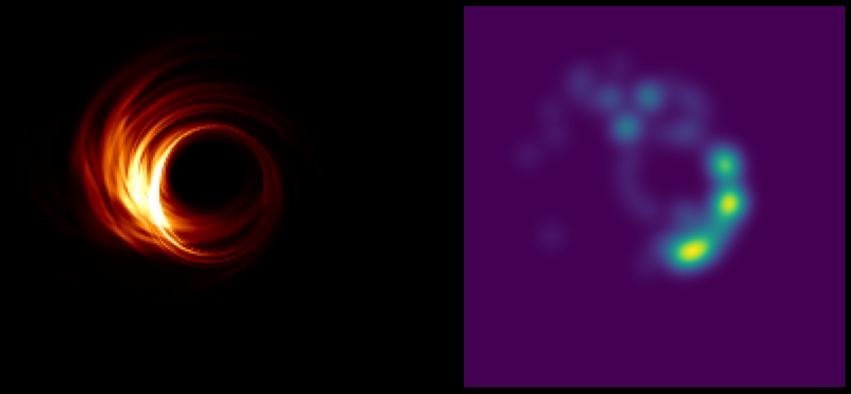
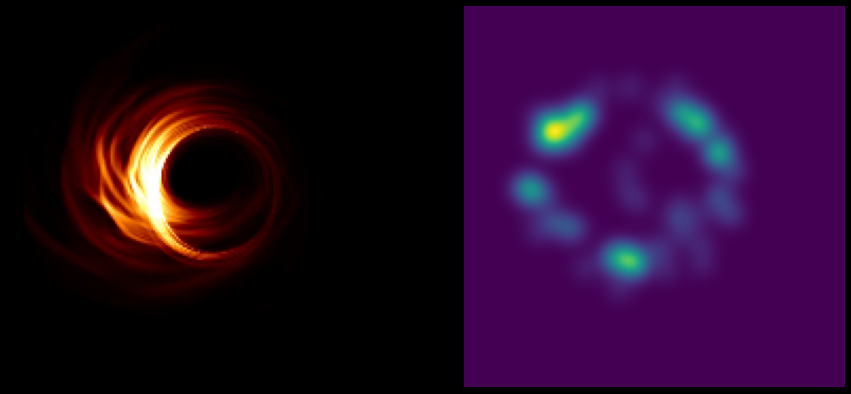
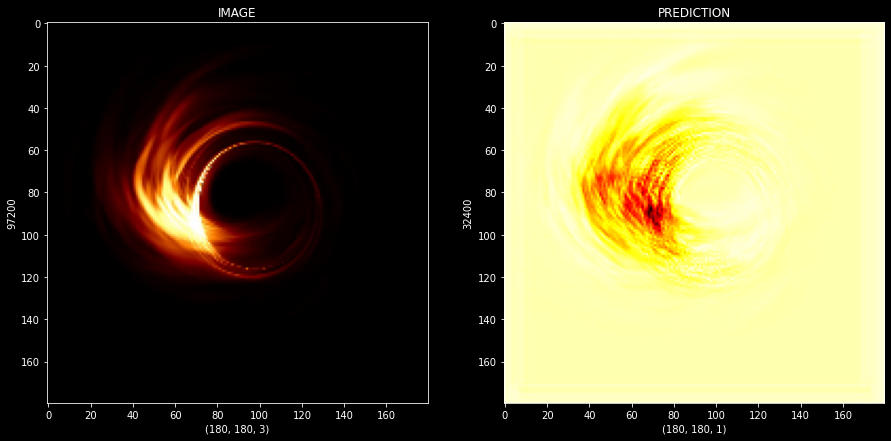
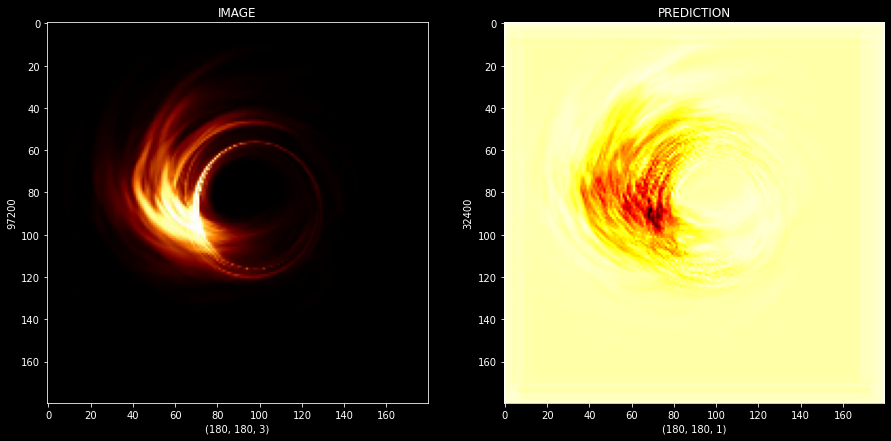
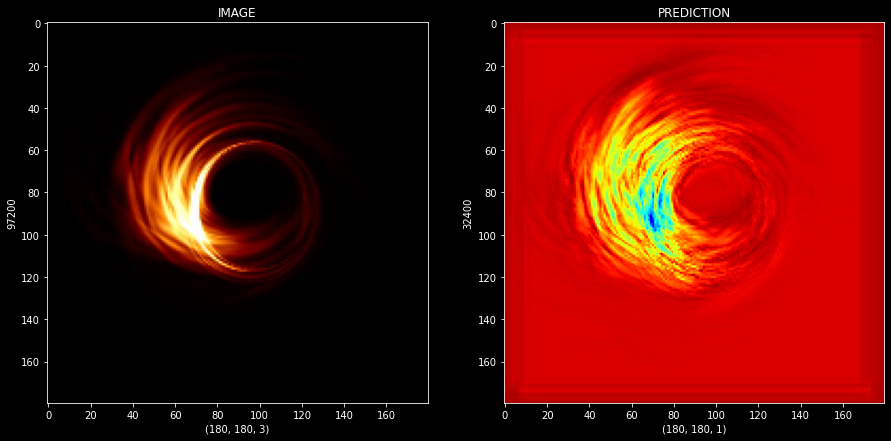
Prediction_IMG = Auto_Encoder.predict(Train_Set)
figure,axis = plt.subplots(1,2,figsize=(15,15))
prediction_img_number = 1

Original_Img = Train_Set[prediction_img_number]
Predict_Target = Prediction_IMG[prediction_img_number]

axis[0].imshow(Original_Img)
axis[0].set_xlabel(Original_Img.shape)
axis[0].set_ylabel(Original_Img.size)
axis[0].set_title("IMAGE")
axis[1].imshow(Predict_Target,cmap="hot")
axis[1].set_xlabel(Predict_Target.shape)
axis[1].set_ylabel(Predict_Target.size)
axis[1].set_title("PREDICTION")
Text(0.5, 1.0, 'PREDICTION')
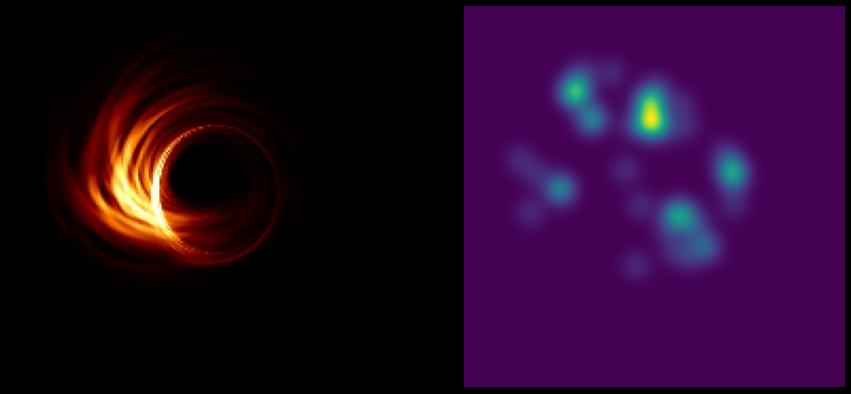
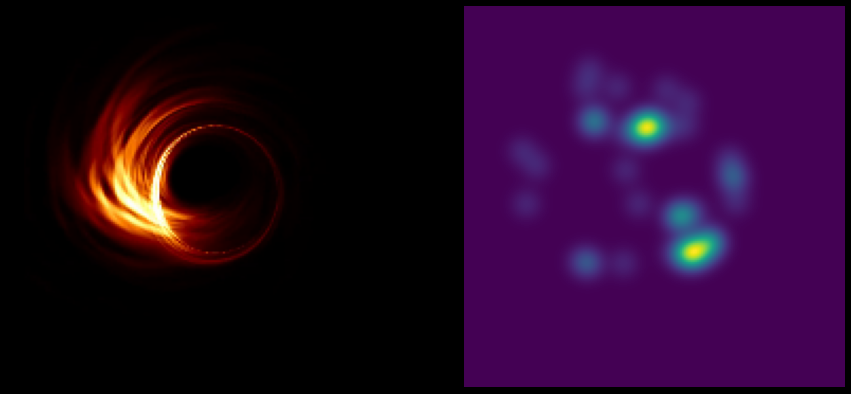
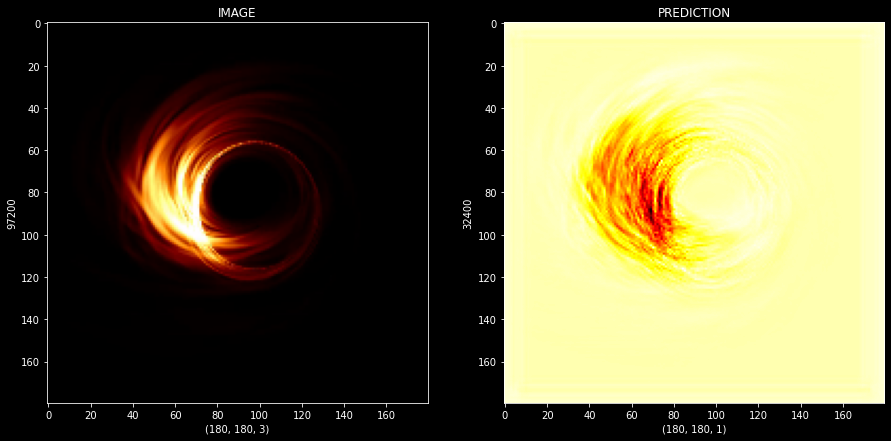
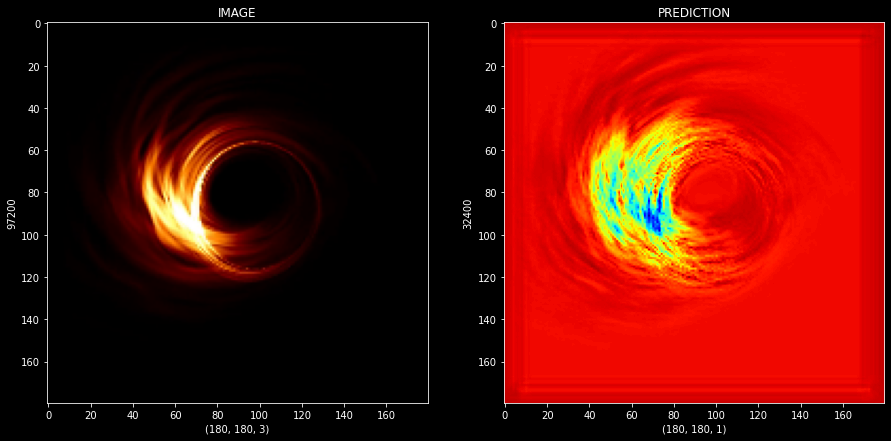
figure,axis = plt.subplots(1,2,figsize=(15,15))
prediction_img_number = 5

Original_Img = Train_Set[prediction_img_number]
Predict_Target = Prediction_IMG[prediction_img_number]

axis[0].imshow(Original_Img)
axis[0].set_xlabel(Original_Img.shape)
axis[0].set_ylabel(Original_Img.size)
axis[0].set_title("IMAGE")
axis[1].imshow(Predict_Target,cmap="hot")
axis[1].set_xlabel(Predict_Target.shape)
axis[1].set_ylabel(Predict_Target.size)
axis[1].set_title("PREDICTION")
Text(0.5, 1.0, 'PREDICTION')
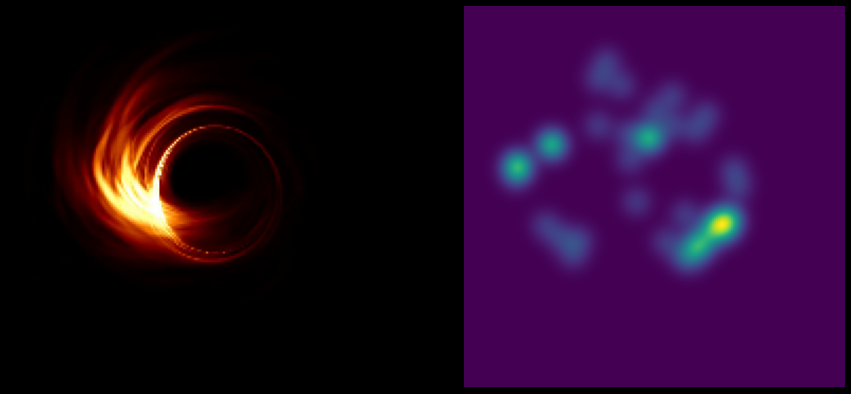
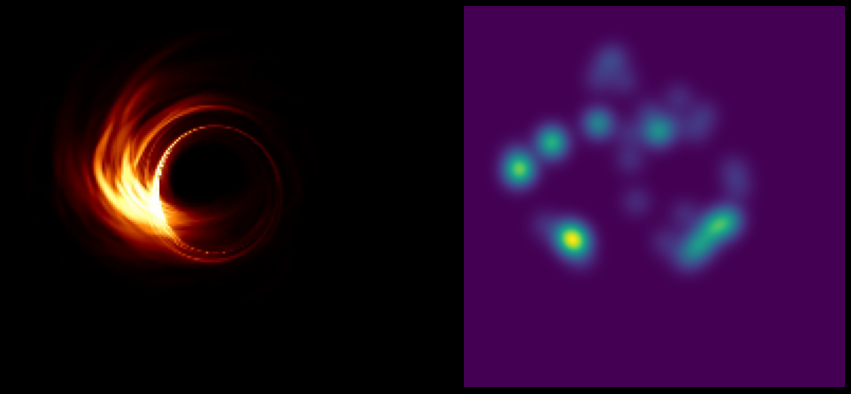
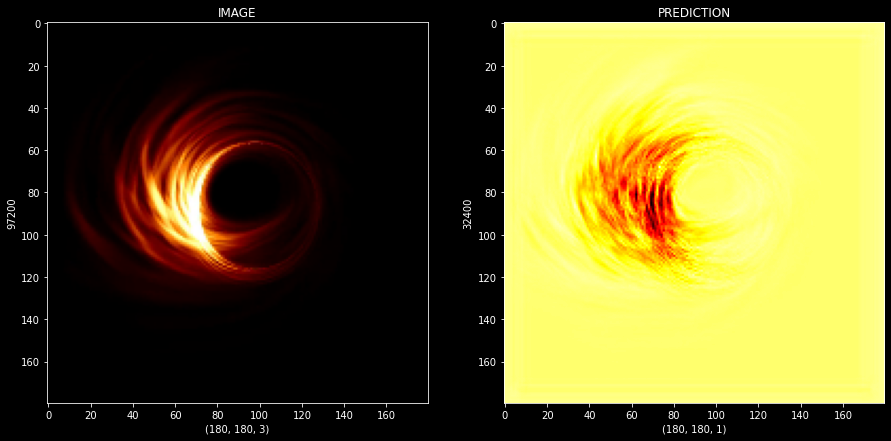
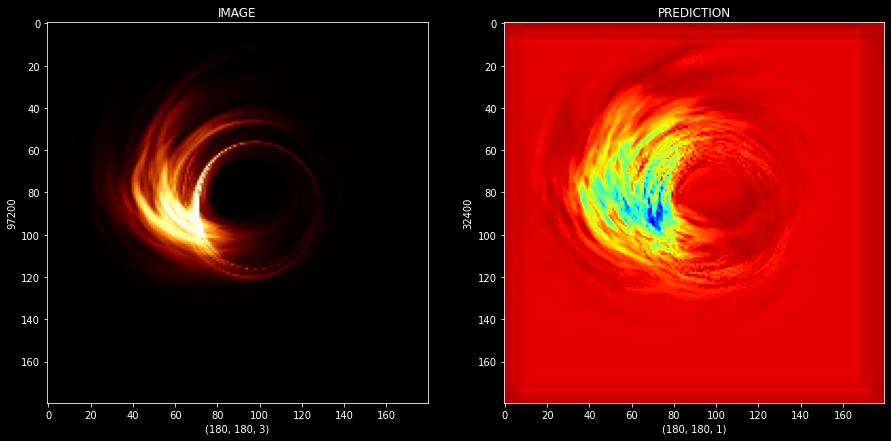
figure,axis = plt.subplots(1,2,figsize=(15,15))
prediction_img_number = 8

Original_Img = Train_Set[prediction_img_number]
Predict_Target = Prediction_IMG[prediction_img_number]

axis[0].imshow(Original_Img)
axis[0].set_xlabel(Original_Img.shape)
axis[0].set_ylabel(Original_Img.size)
axis[0].set_title("IMAGE")
axis[1].imshow(Predict_Target,cmap="hot")
axis[1].set_xlabel(Predict_Target.shape)
axis[1].set_ylabel(Predict_Target.size)
axis[1].set_title("PREDICTION")
Text(0.5, 1.0, 'PREDICTION')

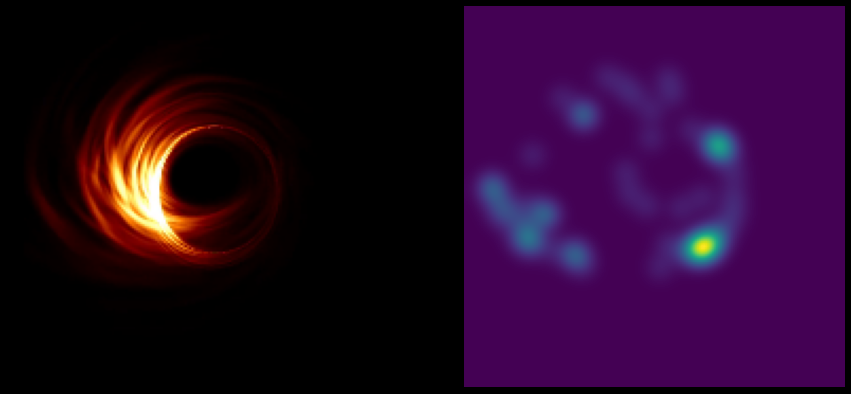
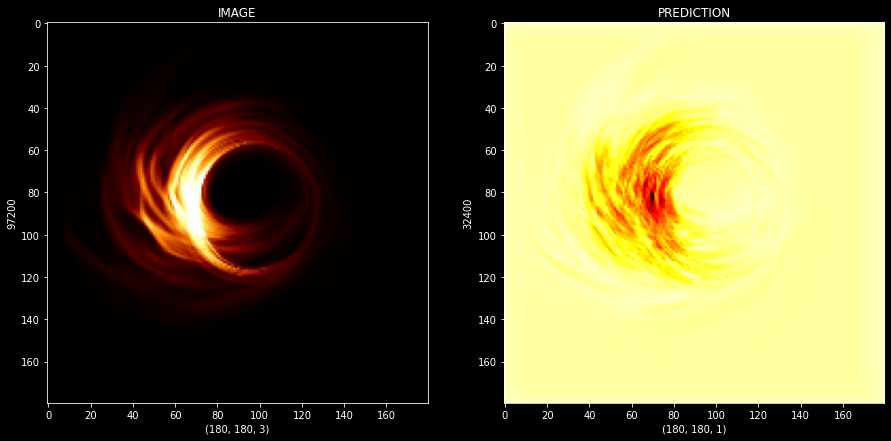
figure,axis = plt.subplots(1,2,figsize=(15,15))
prediction_img_number = 250

Original_Img = Train_Set[prediction_img_number]
Predict_Target = Prediction_IMG[prediction_img_number]

axis[0].imshow(Original_Img)
axis[0].set_xlabel(Original_Img.shape)
axis[0].set_ylabel(Original_Img.size)
axis[0].set_title("IMAGE")
axis[1].imshow(Predict_Target,cmap="hot")
axis[1].set_xlabel(Predict_Target.shape)
axis[1].set_ylabel(Predict_Target.size)
axis[1].set_title("PREDICTION")
Text(0.5, 1.0, 'PREDICTION')
figure,axis = plt.subplots(1,2,figsize=(15,15))
prediction_img_number = 444

Original_Img = Train_Set[prediction_img_number]
Predict_Target = Prediction_IMG[prediction_img_number]

axis[0].imshow(Original_Img)
axis[0].set_xlabel(Original_Img.shape)
axis[0].set_ylabel(Original_Img.size)
axis[0].set_title("IMAGE")
axis[1].imshow(Predict_Target,cmap="hot")
axis[1].set_xlabel(Predict_Target.shape)
axis[1].set_ylabel(Predict_Target.size)
axis[1].set_title("PREDICTION")
Text(0.5, 1.0, 'PREDICTION')

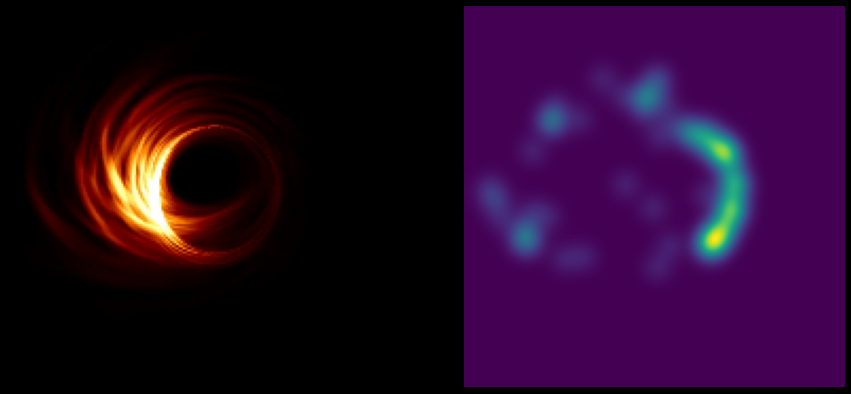
figure,axis = plt.subplots(1,2,figsize=(15,15))
prediction_img_number = 450

Original_Img = Train_Set[prediction_img_number]
Predict_Target = Prediction_IMG[prediction_img_number]

axis[0].imshow(Original_Img)
axis[0].set_xlabel(Original_Img.shape)
axis[0].set_ylabel(Original_Img.size)
axis[0].set_title("IMAGE")
axis[1].imshow(Predict_Target,cmap="hot")
axis[1].set_xlabel(Predict_Target.shape)
axis[1].set_ylabel(Predict_Target.size)
axis[1].set_title("PREDICTION")
Text(0.5, 1.0, 'PREDICTION')
figure,axis = plt.subplots(1,2,figsize=(15,15))
prediction_img_number = 500

Original_Img = Train_Set[prediction_img_number]
Predict_Target = Prediction_IMG[prediction_img_number]

axis[0].imshow(Original_Img)
axis[0].set_xlabel(Original_Img.shape)
axis[0].set_ylabel(Original_Img.size)
axis[0].set_title("IMAGE")
axis[1].imshow(Predict_Target,cmap="hot")
axis[1].set_xlabel(Predict_Target.shape)
axis[1].set_ylabel(Predict_Target.size)
axis[1].set_title("PREDICTION")
Text(0.5, 1.0, 'PREDICTION')
figure,axis = plt.subplots(1,2,figsize=(15,15))
prediction_img_number = 288

Original_Img = Train_Set[prediction_img_number]
Predict_Target = Prediction_IMG[prediction_img_number]

axis[0].imshow(Original_Img)
axis[0].set_xlabel(Original_Img.shape)
axis[0].set_ylabel(Original_Img.size)
axis[0].set_title("IMAGE")
axis[1].imshow(Predict_Target,cmap="jet")
axis[1].set_xlabel(Predict_Target.shape)
axis[1].set_ylabel(Predict_Target.size)
axis[1].set_title("PREDICTION")
Text(0.5, 1.0, 'PREDICTION')
figure,axis = plt.subplots(1,2,figsize=(15,15))
prediction_img_number = 88

Original_Img = Train_Set[prediction_img_number]
Predict_Target = Prediction_IMG[prediction_img_number]

axis[0].imshow(Original_Img)
axis[0].set_xlabel(Original_Img.shape)
axis[0].set_ylabel(Original_Img.size)
axis[0].set_title("IMAGE")
axis[1].imshow(Predict_Target,cmap="jet")
axis[1].set_xlabel(Predict_Target.shape)
axis[1].set_ylabel(Predict_Target.size)
axis[1].set_title("PREDICTION")
Text(0.5, 1.0, 'PREDICTION')
figure,axis = plt.subplots(1,2,figsize=(15,15))
prediction_img_number = 8

Original_Img = Train_Set[prediction_img_number]
Predict_Target = Prediction_IMG[prediction_img_number]

axis[0].imshow(Original_Img)
axis[0].set_xlabel(Original_Img.shape)
axis[0].set_ylabel(Original_Img.size)
axis[0].set_title("IMAGE")
axis[1].imshow(Predict_Target,cmap="jet")
axis[1].set_xlabel(Predict_Target.shape)
axis[1].set_ylabel(Predict_Target.size)
axis[1].set_title("PREDICTION")
Text(0.5, 1.0, 'PREDICTION')
figure,axis = plt.subplots(1,2,figsize=(15,15))
prediction_img_number = 221

Original_Img = Train_Set[prediction_img_number]
Predict_Target = Prediction_IMG[prediction_img_number]

axis[0].imshow(Original_Img)
axis[0].set_xlabel(Original_Img.shape)
axis[0].set_ylabel(Original_Img.size)
axis[0].set_title("IMAGE")
axis[1].imshow(Predict_Target,cmap="jet")
axis[1].set_xlabel(Predict_Target.shape)
axis[1].set_ylabel(Predict_Target.size)
axis[1].set_title("PREDICTION")
Text(0.5, 1.0, 'PREDICTION')